



Asymmetric hydrologic alteration in depressional wetlands: Groundwater pumping disproportionately depresses low water levels in cypress domes
CRC: https://orcid.org/0000-0001-7362-2810
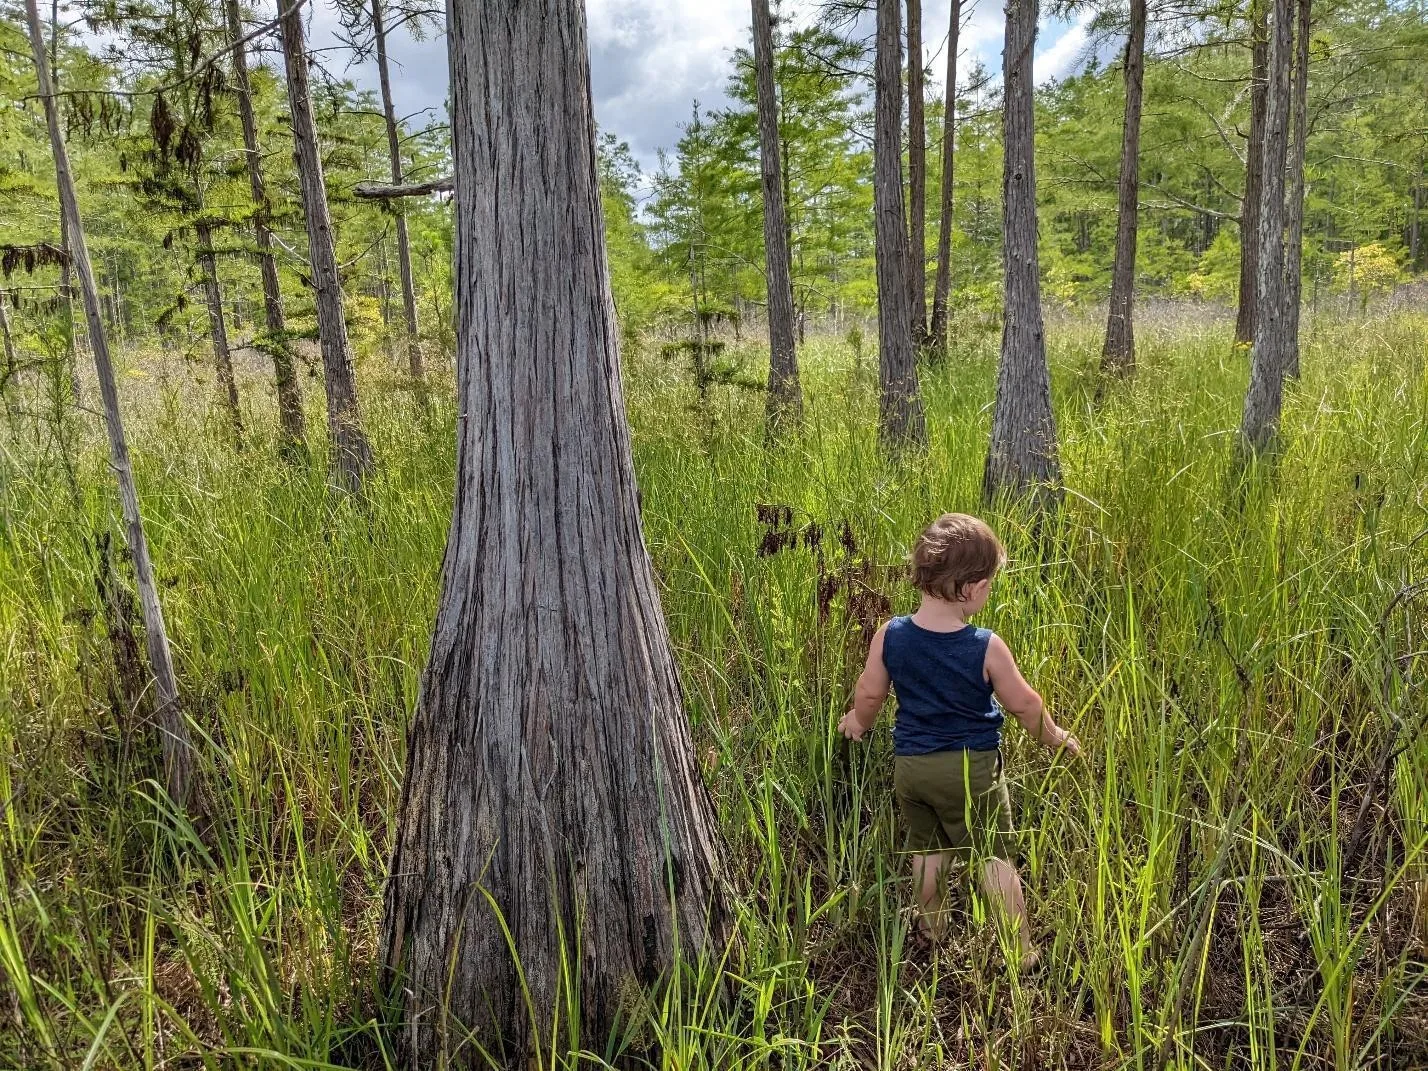
Abstract photo. Inside a Florida cypress dome during dry conditions, showing characteristic pondcypress trees (Taxodium ascendens) and ground cover vegetation.
Abstract
Groundwater pumping can affect wetland hydrology, but differential impacts across the water level distribution are rarely quantified. Historical water level data from ecologically changed and unchanged Florida cypress domes were reanalyzed to characterize how pumping reshapes water level distributions. Changed wetlands showed faster recession rates and greater water level variability, and impacts were greatest at low water levels. However, changed wetlands achieved seasonal highs somewhat regularly, as high rainfall events fill shallow morphology. Environmental levels established using only peak inundation metrics could miss ecological degradation. This short paper aims to highlight historical hydrologic data, document asymmetric pumping impacts, and encourage additional work on lentic environmental flows.
Keywords: depressional wetland, environmental flows, flow duration curve, hydrogeology
Introduction
Groundwater use threatens freshwater ecosystems around the world (Acreman and McCartney 2009, De Graaf et al., 2019, Condon and Maxwell 2019, De Graaf et al., 2024). Pumping can capture groundwater that would flow to waterbodies or exacerbate leakage from waterbodies to groundwater (Gilvear and Bradley 2009, Zhou et al., 2023). Impacts are not uniform across the hydrograph, with low water conditions frequently more affected (Cooper et al., 2015, Gleeson and Richter 2018, Lapides et al., 2023).
Florida’s northern Tampa Bay area offers an excellent case study to evaluate these effects. Intensive wellfield pumping historically depressed hydrology at waterbodies throughout the region from the 1960s to 1990s (Hancock and Anderson 1996, Bartholomew et al., 2020, Fouad and Lee 2021, Hancock and Leeper 2023, Metz 2011, Balerna et al., 2023, 2024). Responding to these impacts, the Southwest Florida Water Management District developed the Cypress Offset, a method to identify “significantly harmed” cypress dome wetlands (SWFWMD 1999).
To develop its metric, SWFWMD (1999) assessed 36 cypress wetlands, 21 unchanged and 15 changed, selected largely based on water level data availability (Figure 1). Unchanged wetlands occur in close proximity to changed wetlands because of hydrogeologic heterogeneity (Metz 2011, Cameron et al., 2023). Ecological change designations were based on expert assessments of shrub stratum, vegetative succession, invasive species, and soil subsidence. To identify a threshold between changed and unchanged wetlands, SWFWMD used an equal error rate method on multiyear water level (composite stage and well) data normalized to “normal pool”, a field-derived seasonal high-water level (Figure 2). They reliably detected impacts when median water levels fell more than 1.8 ft (55 cm) below normal pool.
The Cypress Offset has been validated, peer reviewed twice, and used to set “minimum levels” for numerous cypress domes (Bedient et al., 1999, Campbell et al., 2020, Cameron et al., 2022, Emery et al., 2022). However, the median water level is responsive to rainfall conditions, increasing toward the normal pool elevation during wet conditions, particularly at changed wetlands (Cameron et al., 2022). This means the 55 cm threshold value, while a reasonable tool for predicting “significant harm” using water level data, carries some uncertainty when applied to individual wetlands or different time periods. This necessitates a “weight of the evidence” approach for status assessments (Cameron et al., 2022, Emery et al., 2022).
Minimum levels determined by the Cypress Offset have served as part of a much larger regional recovery effort. Substantial infrastructure investment, including a desalination plant and off-stream reservoir, nearly halved wellfield pumping (Basso et al., 2020, Hogg et al., 2020). Wellfield cutbacks were achieved in phases starting in the early 2000s. Widespread hydrologic improvement occurred in ecosystems throughout the region, although vegetation response can lag hydrologic changes by decades (Bartholomew et al., 2020, Basso et al., 2020, Hogg et al., 2020, Cameron et al., 2022, Thurman and Crisman 2023, Balerna et al., 2023, 2024).
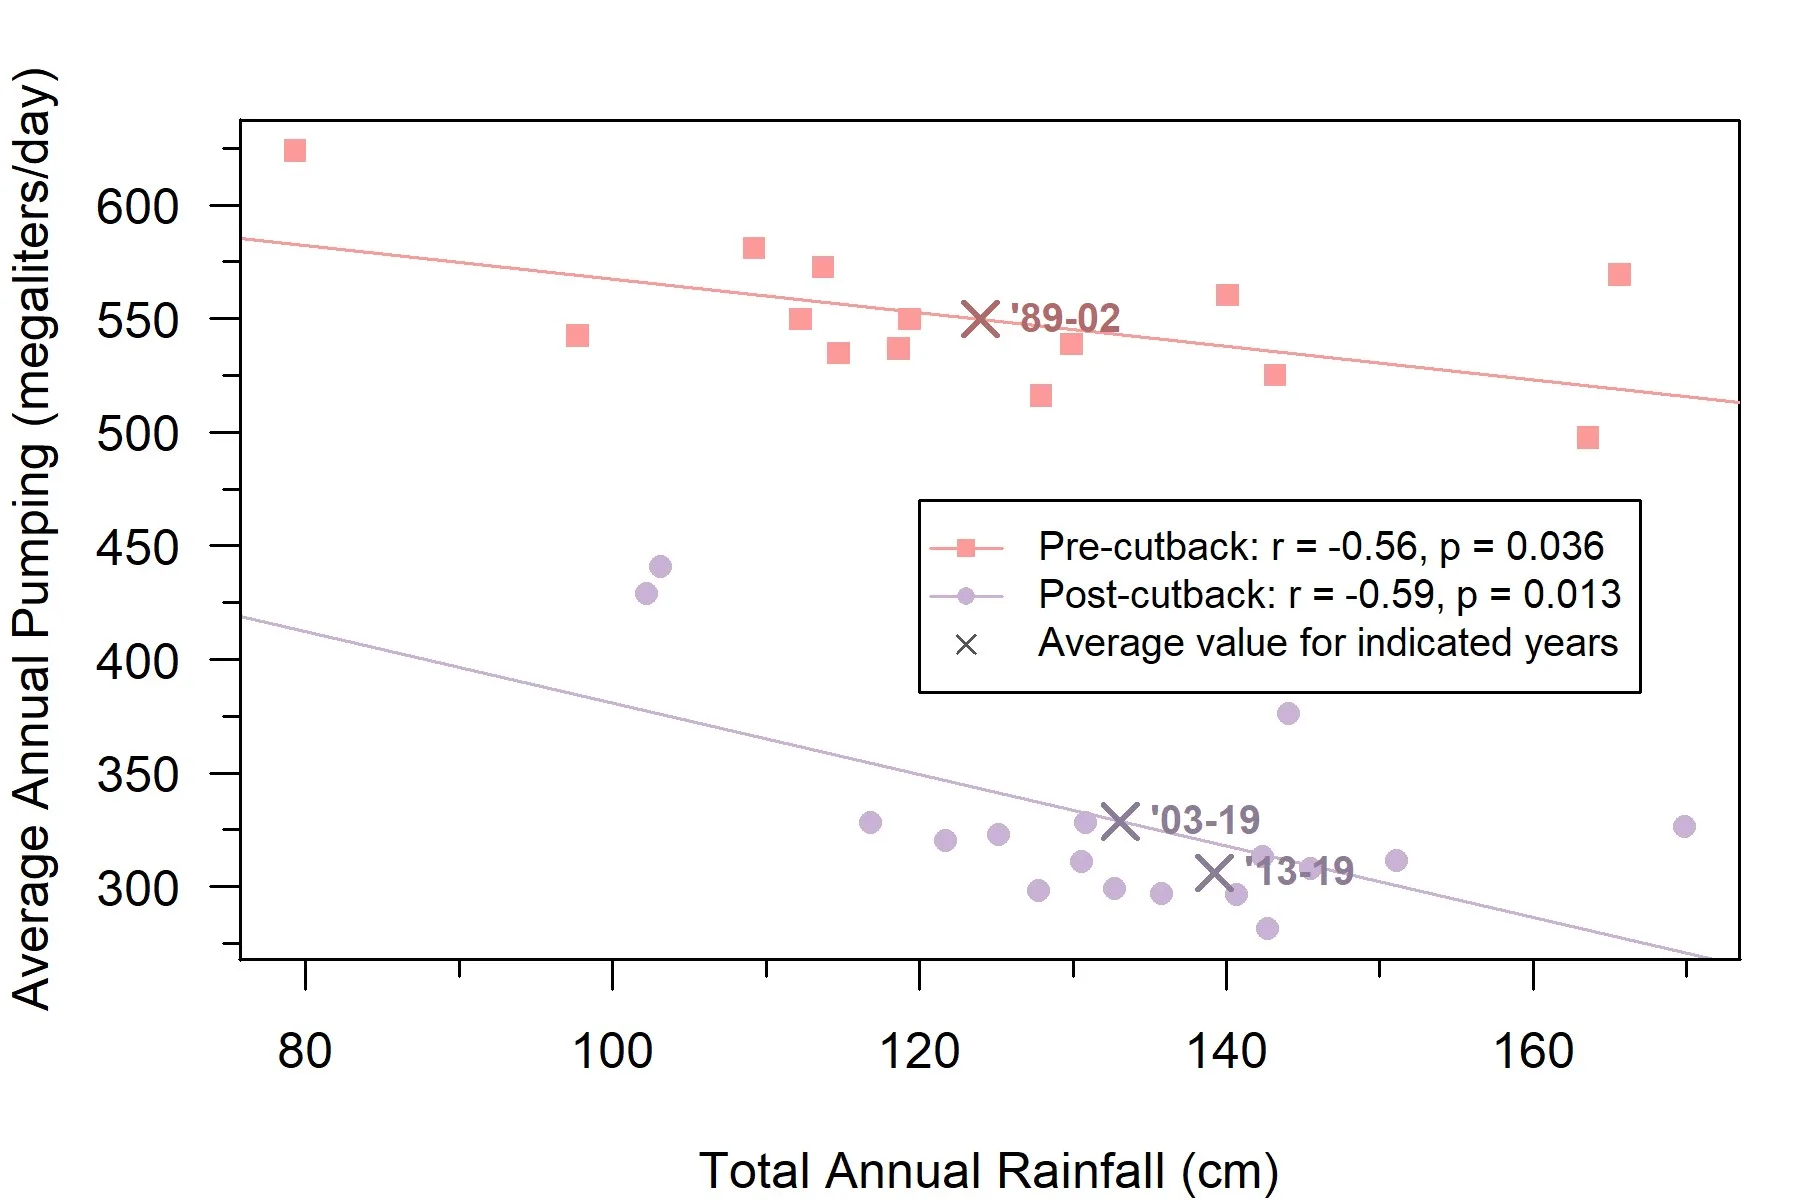
Regional water managers understand that groundwater pumping generally has greater impacts on low-end hydrology at lakes and wetlands (SWFWMD 1999, Basso et al., 2020, Cameron et al., 2023, Qi et al., 2024). This reflects, in part, that pumping tends to be greater during dry periods (Figure 3). It also reflects that once wetland water levels drop below the ground surface, the same volume water loss produces larger depth declines, because surficial aquifer specific yields are lower than open water specific yields (Nilsson et al., 2013). Furthermore, at cypress domes, shallow (30–70 cm) morphology allows rapid filling during high rainfall events common during summers, with runoff and surficial aquifer flows from surrounding uplands contributing water (Lee et al., 2009, Nilsson et al., 2013, Cameron et al., 2023). Additionally, outflows through “natural saddles” or other surface outlets can cap maximum stages (Campbell et al., 2020). This moderates pumping impacts on high water levels. However, limited work has quantified differential pumping impacts across the entire hydrograph.
This study reanalyzes SWFWMD (1999) data to characterize the hydrologic impacts of groundwater pumping across the water level distribution and to better understand what the Cypress Offset captures about wetland response. The SWFWMD (1999) dataset is valuable in assessing wetland condition from ecological evidence rather than inferred from hydrology, and data predate regional recovery. This allows direct investigation of hydrologic signatures associated with ecologic degradation, without confounding influences of recovery.
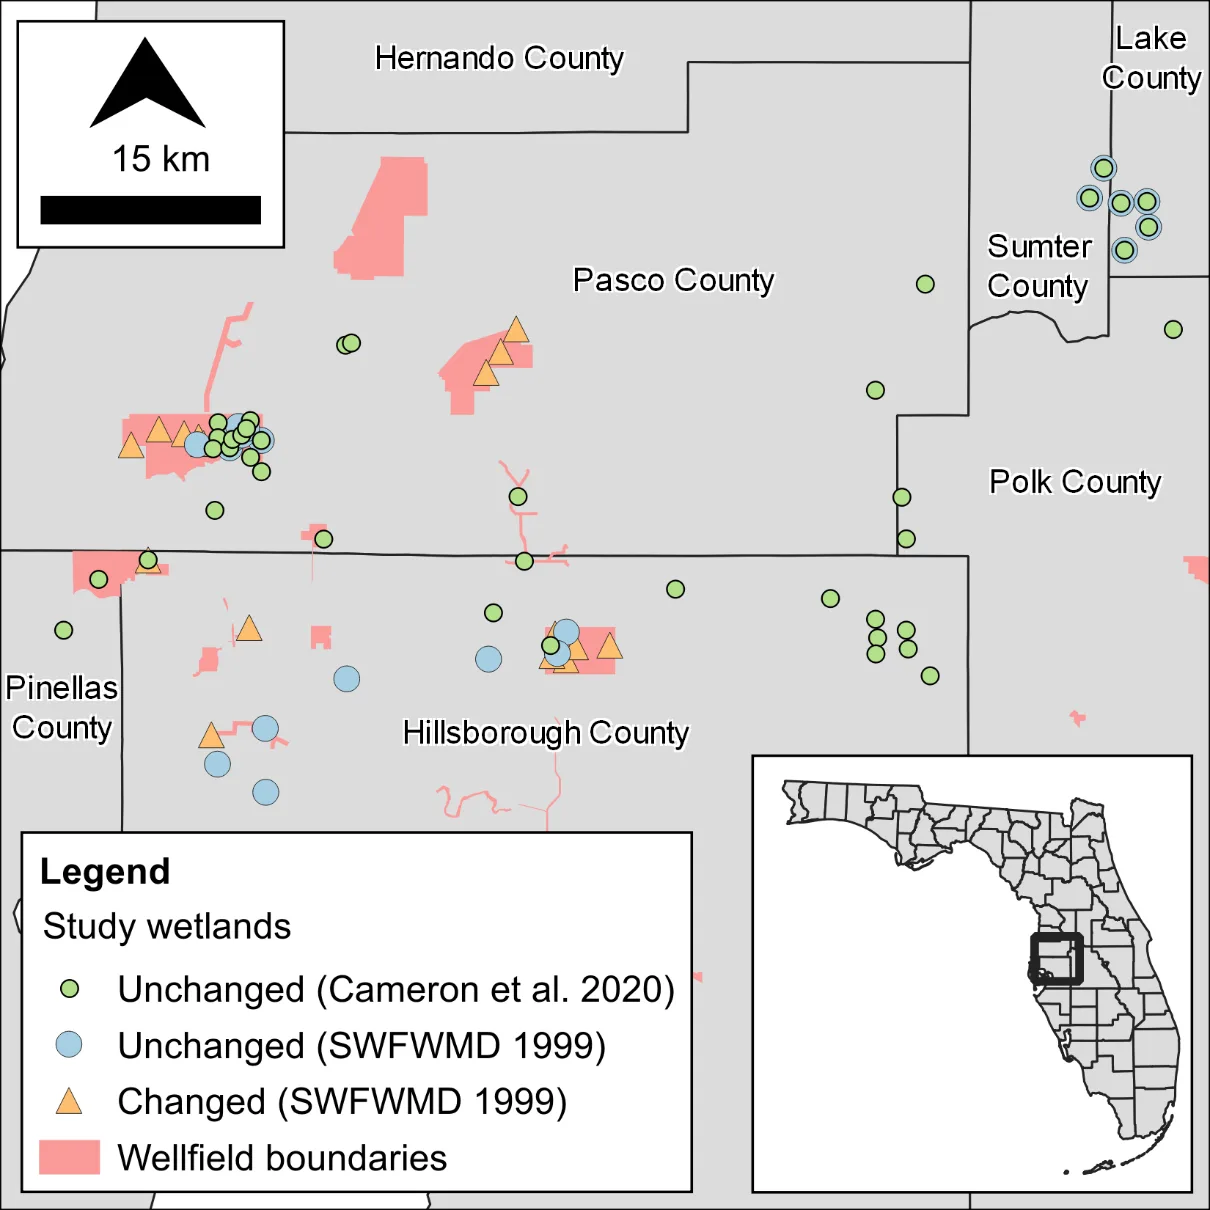
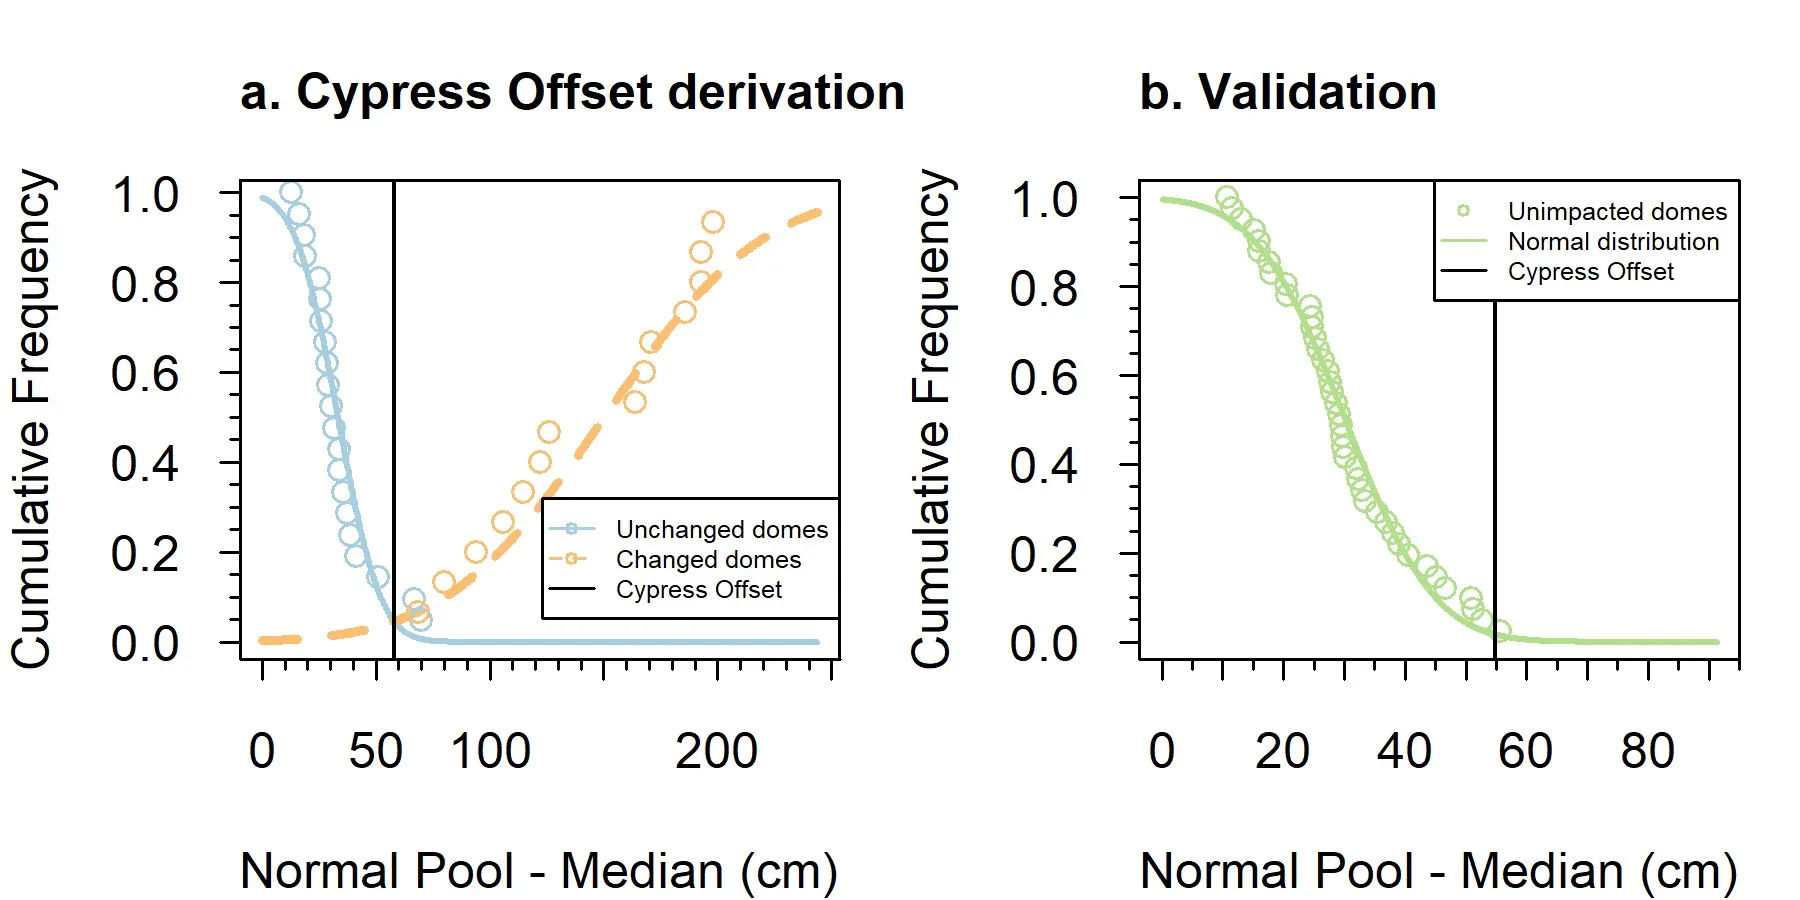
Figure 2. Derivation and validation of the Cypress Offset based on (a) equal error rates between 21 unchanged and 15 changed cypress domes (SWFWMD 1999) using 1989–2002 water level data and (b) distribution for 41 unchanged cypress domes using 2013-2019 water level data (Cameron et al., 2020, 2022). Despite differing rainfall conditions (mean 123.96 cm for 1989-2002 versus 139.21 cm for 2013-2019), very few unchanged cypress domes’ median water level fell more than 55 cm below normal pool in either sample.
Methods and Materials
As this is a simple case study reanalyzing existing data, descriptions of the study area, data collection, and limitations are deferred to SWFWMD (1999) and Cameron et al., (2020, 2022). Water level data were acquired from those studies as compiled in Cameron et al., (2022) from modern SWFWMD and Tampa Bay Water databases. These data consist of staff gage (above-ground) data, supplemented with wetland well (below-ground) data when the wetland was dry at the staff gage, creating a “composite” time series. However, before approximately 2000, many wetland wells were hand-dug and relatively shallow (SWFWMD 1999, 2022). All water level data used in this study are monthly means reported relative to normal pool elevations.
Comparing changed and unchanged wetlands
Water level data 1989–2002 (prior to wellfield cutbacks) were assessed for SWFWMD’s (1999) 36 cypress wetlands, including 21 unchanged wetlands and 15 changed wetlands. Hydrologic metrics were compared between the two groups (Figures 4-6; Table 1): nonexceedance percentiles, mean recession rate (negative consecutive differences), mean recovery rate (positive consecutive differences), time near normal pool (months per year within 10 cm of normal pool), and water level variability (standard deviation). Wilcoxon rank-sum and Fligner-Killeen (1976) tests were used to compare distribution locations (central values) and scales (spreads), respectively.
Regional representativeness of unchanged wetlands
Water level data from 2013–2019 were assessed for 41 cypress domes considered to have minimal anthropogenic influences (Cameron et al., 2020). Wilcoxon rank-sum and Fligner-Killeen (1976) tests were used to compare the hydrologic metrics between these 41 cypress domes and the unchanged wetlands from SWFWMD’s (1999) sample (Table 1).
Areas and depths
Ground elevations at measuring devices were obtained from SWFWMD and Tampa Bay Water. Wetland depth was calculated as normal pool less ground elevation for each wetland (Figure 7). Wetland areas were calculated from a geospatial layer of wetlands obtained from SWFWMD. Wilcoxon rank-sum and Fligner-Killeen (1976) tests were used for comparisons between wetland groups (Table 1).
Rainfall
Rainfall data were acquired from SWFWMD (2026) for the “Central” region covering the study area (Figure 3).
Results
Differences in hydrologic metrics between changed and unchanged wetlands were smallest at highest water levels and greatest at lowest water levels (Figures 4-5).
Changed wetlands showed significantly (p < 0.05) faster recovery rates, faster recession rates, lower time near normal pool, and higher variability for location (central value) (Figure 6; Table 1). Scale (spread) was only significantly different for recovery rates and variability. Wetland areas and depths were not significantly different between groups (Figure 7; Table 1).
The two unchanged wetland samples were not significantly different for any metric (Figures 6-7; Table 1).
Annual average rainfall was 123.96 cm for the 1989–2002 study period and 139.21 cm for the 2013–2019 study period (Figure 3). Annual rainfall did not differ significantly between the two periods for either location (p = 0.056) or scale (p = 0.075).
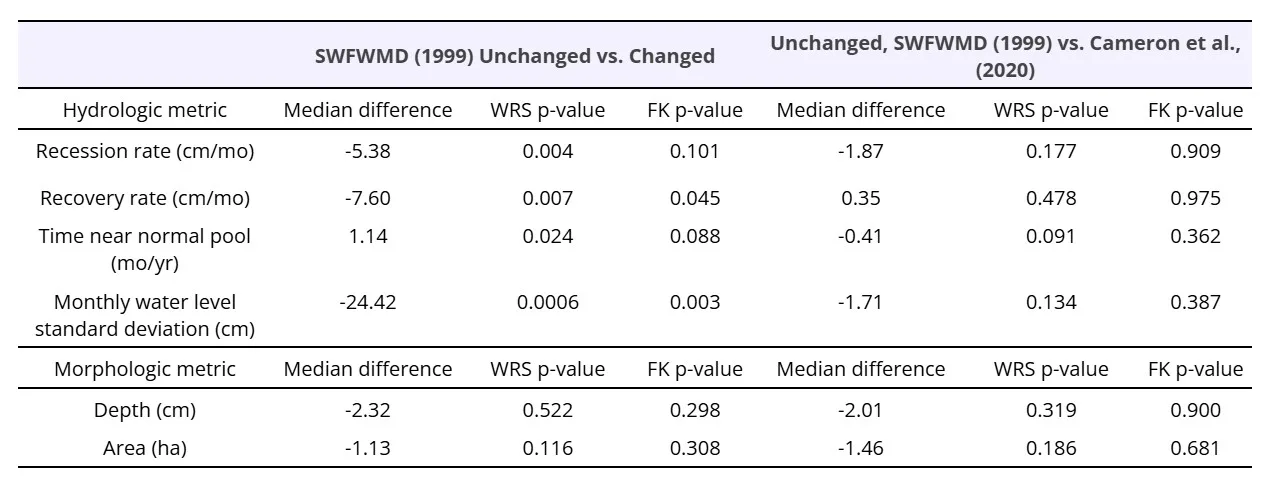
Table 1. Results of Wilcoxon rank-sum (WRS) and Fligner-Killeen (FK) tests comparing metrics between SWFWMD (1999) unchanged (n = 21) and changed (n = 15) wetlands and between unchanged wetlands from SWFWMD (1999) and Cameron et al., (2020; n = 41).
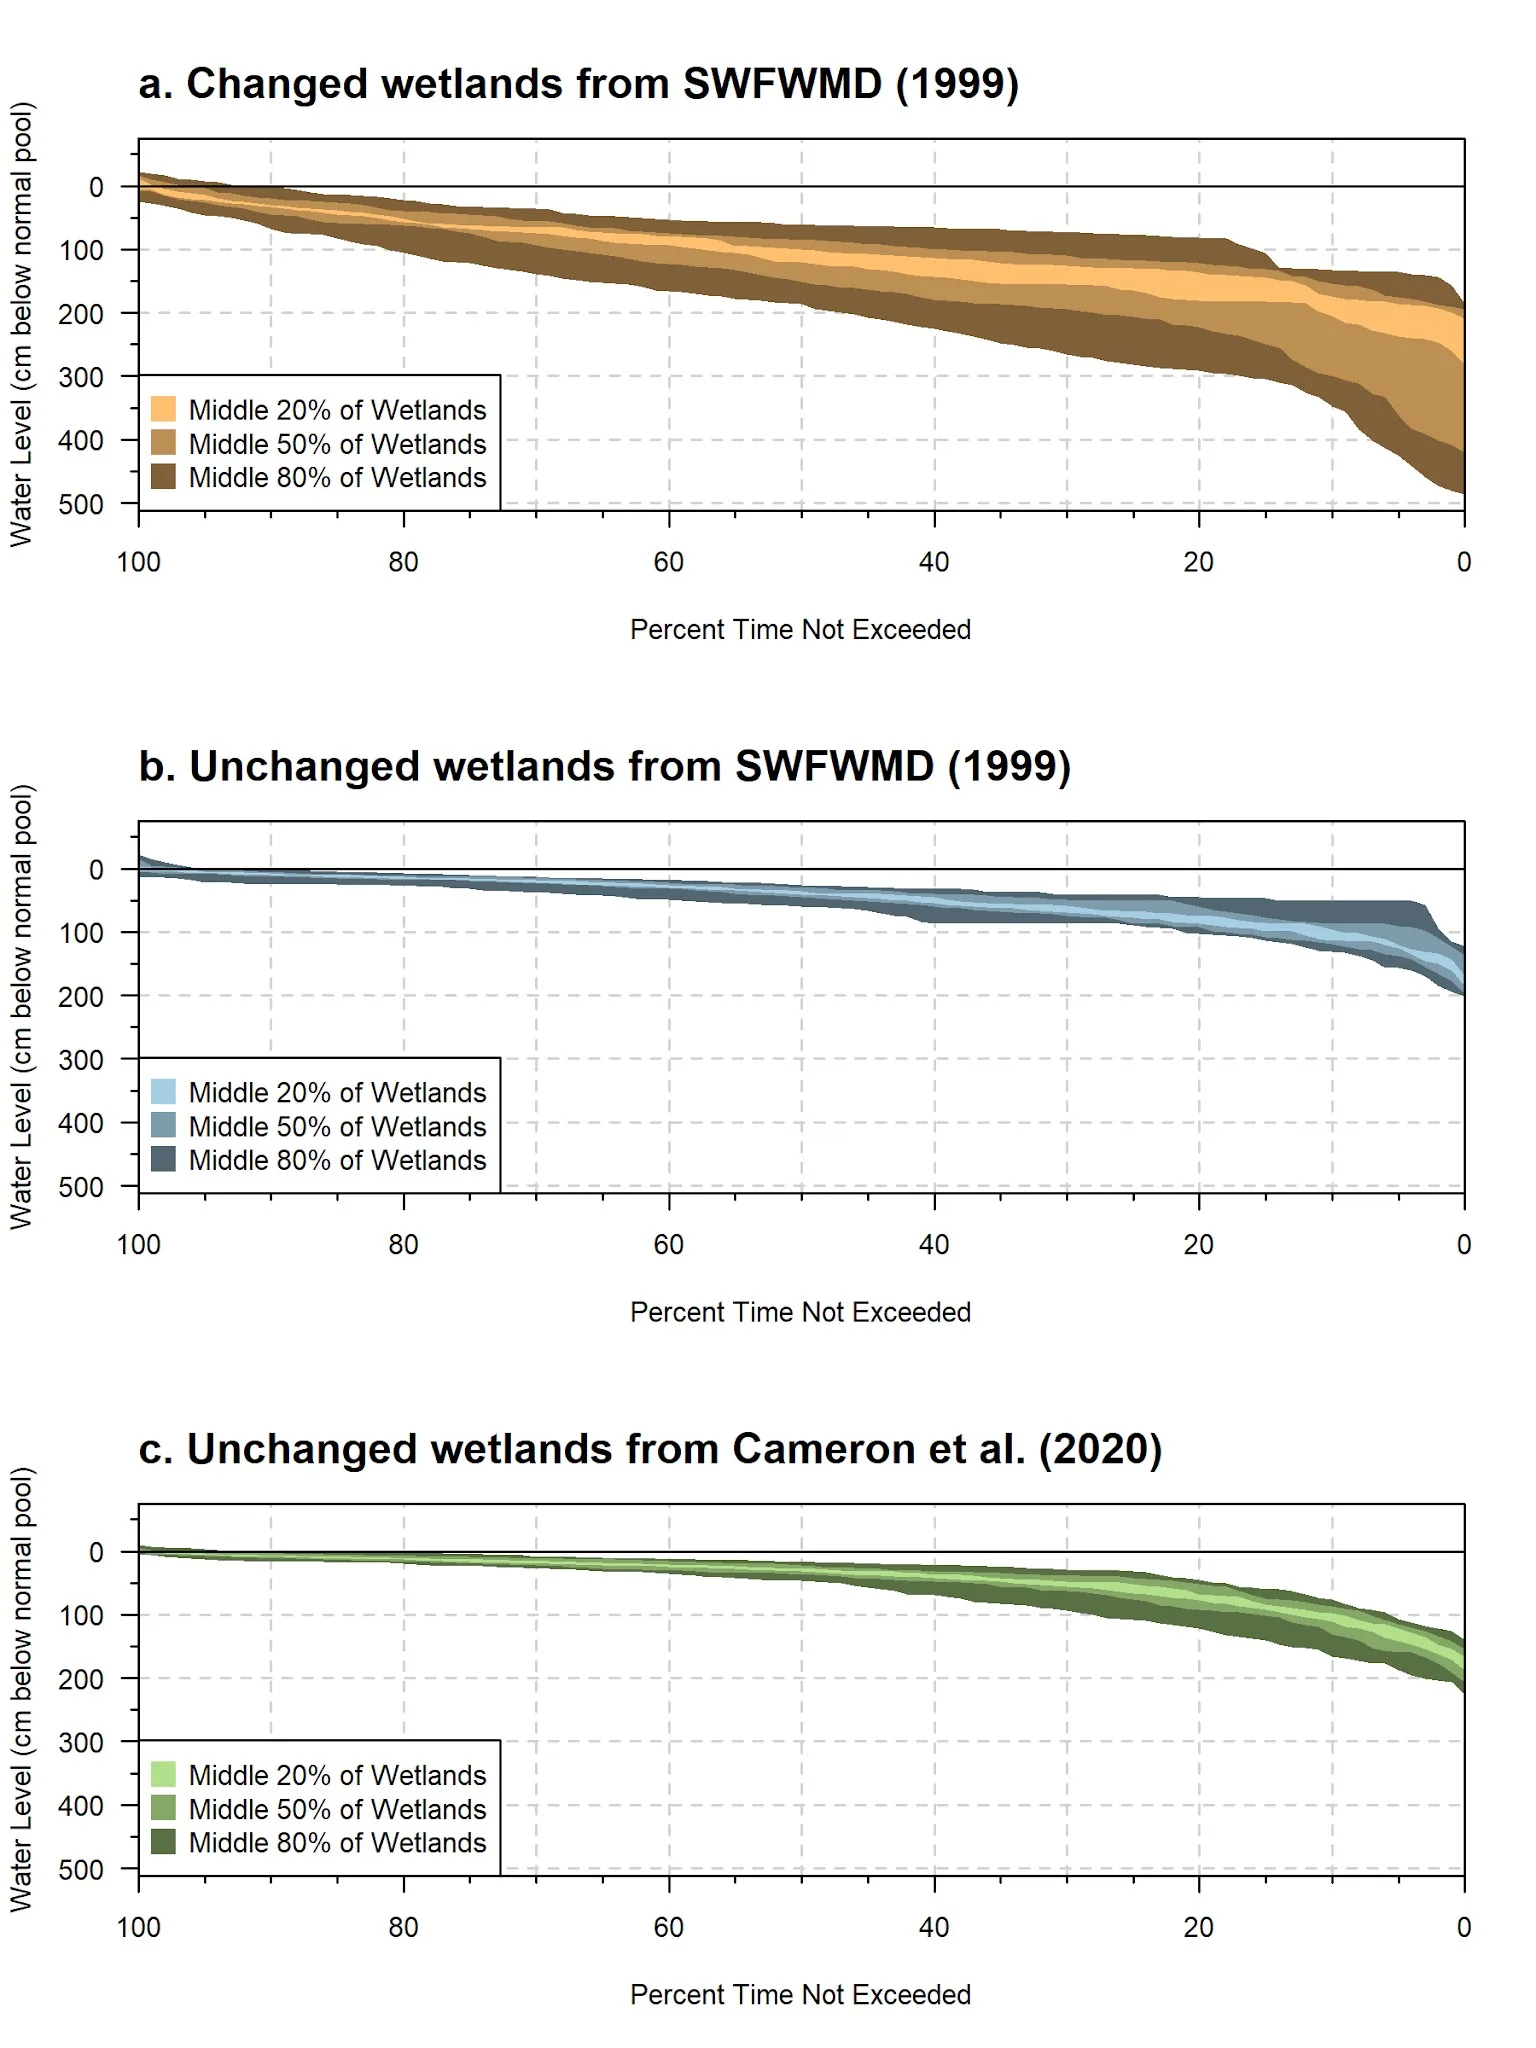
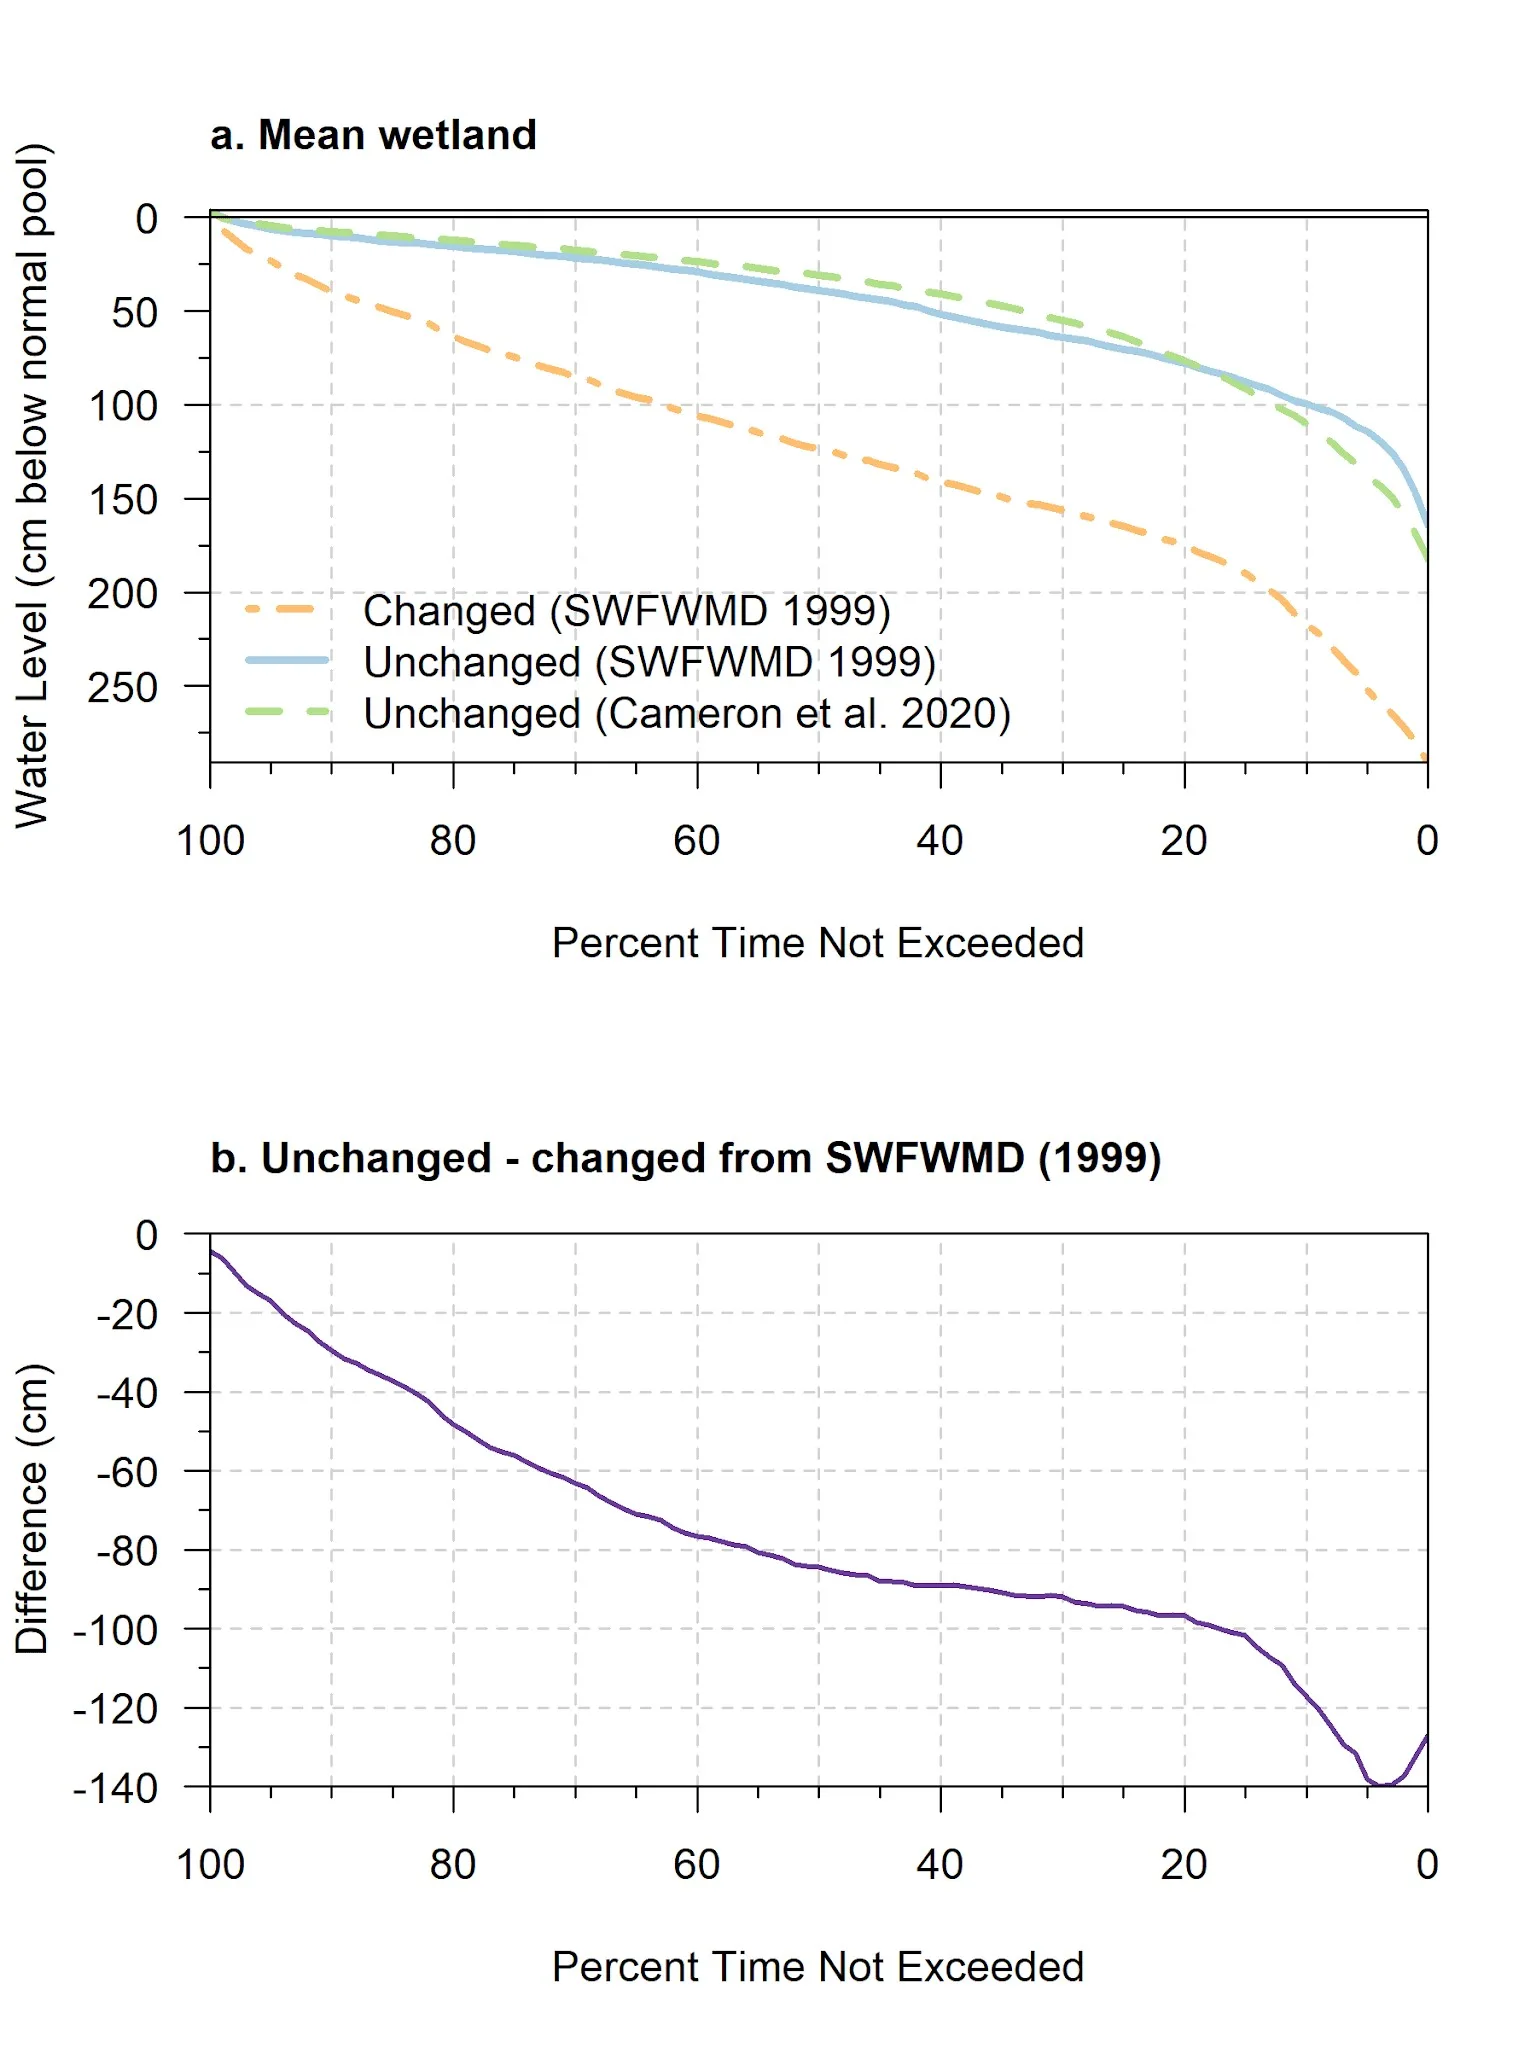
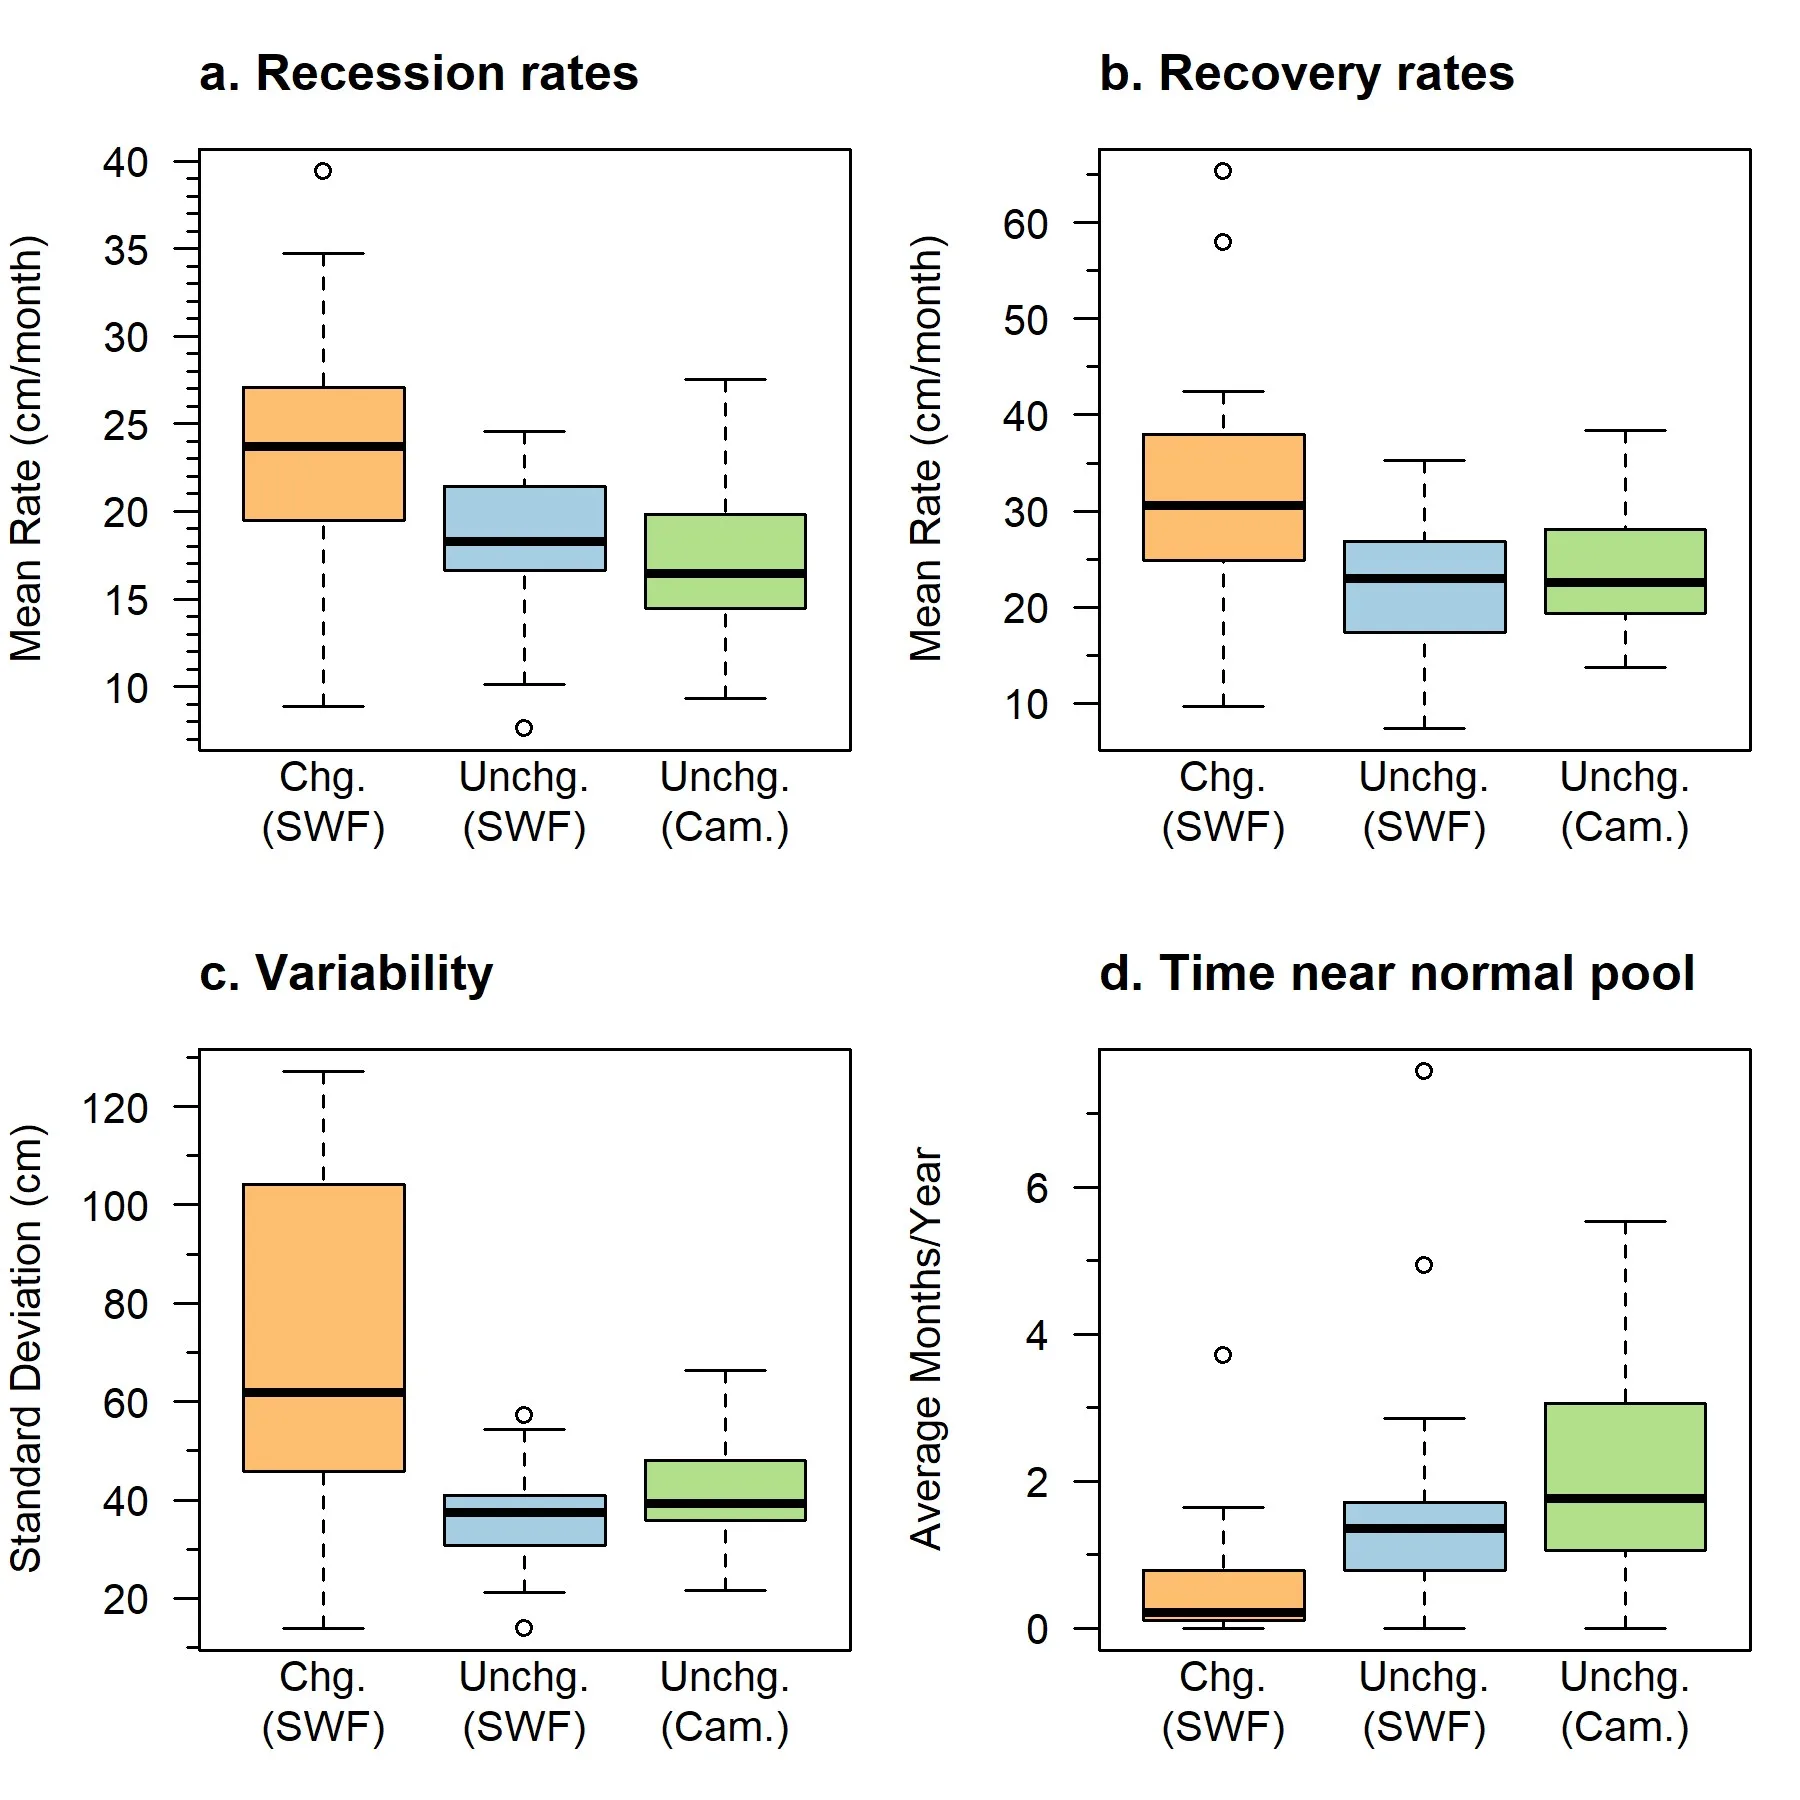
Figure 6. Box plots comparing hydrological characteristics of changed and unchanged wetlands: (a) recession rates, (b) recovery rates, (c) water level variability, and (d) time near normal pool for changed wetlands from SWFWMD (1999; Chg. SWF; n = 15), unchanged wetlands from SWFWMD (1999; Unchg. SWF; n = 21), and unchanged wetlands from Cameron et al., (2020; Unchg. Cam.; n = 41).
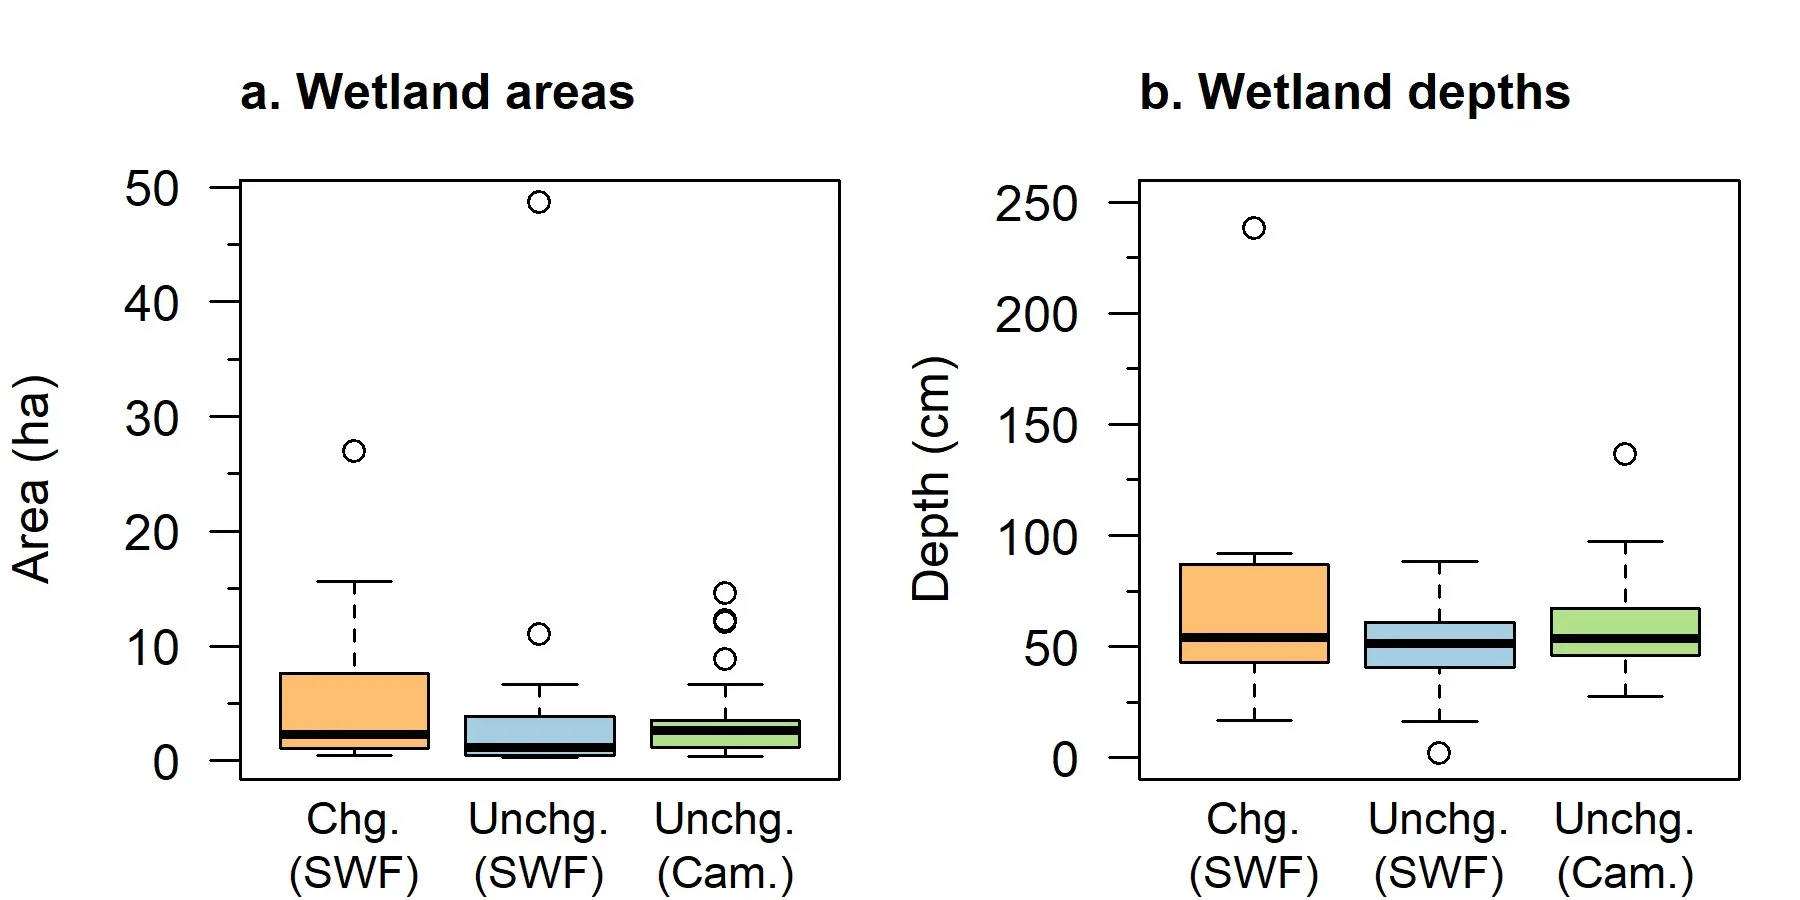
Figure 7. Box plots comparing hydrological characteristics of changed and unchanged wetlands: (a) wetland areas and (b) wetland depths for changed wetlands from SWFWMD (1999; Chg. SWF; n = 15), unchanged wetlands from SWFWMD (1999; Unchg. SWF; n = 21), and unchanged wetlands from Cameron et al., (2020; Unchg. Cam.; n = 41).
Discussion
Groundwater pumping disproportionately depresses low water levels at vulnerable cypress domes. Impacts increase along the distribution (Figures 4-5). At changed wetlands, lower median water levels and higher variability produce an extended lower tail, while basin morphology truncates the upper tail of water levels. Overall, nonexceedance curves are more similar between changed and unchanged wetlands at high water levels, making peak stages less useful for distinguishing states. Differences become more apparent at lower levels, such as the median where the Cypress Offset operates.
As a potential complementary metric to the Cypress Offset, water level variability showed relatively small overlap between changed and unchanged groups, making variability-based metrics candidates for threshold development. At wetlands with long histories of hydrologic impacts, field-derived normal pool elevations can be unreliable (Cameron and Venning 2025). Variability and other metrics that do not require a reference elevation represent a promising research avenue. Percent time inundated may also be useful to distinguish condition but would benefit from bathymetry data rather than point-based gage land surface elevations.
Critically, specific yield differences between above- and below-ground conditions contribute to asymmetric impacts and to greater variability at changed wetlands. Hydrologically stressed wetlands spend more time with water levels in the subsurface, where the same volume of water change produces a larger depth change than it would in open water. Differences in soil specific yields between changed and unchanged wetlands could thus contribute to differences in hydrologic metrics independently of pumping impacts. However, these two pathways are difficult to disentangle, as hydrogeology shapes sensitivity to pumping (Metz 2011), while pumping drives water levels into ranges where specific yield differences exert greatest influence. Maximum depth did not significantly differ between groups (Table 1; Figure 7), so morphology does not explain why changed wetlands show greater variability than unchanged wetlands (water levels in shallow domes may naturally spend more time in the subsurface; Cameron et al., 2020). More investigation and wetland-specific soils data are needed to better understand how specific yield and composite data influence results.
Furthermore, all of these hydrologic metrics are influenced by the rainfall and pumping that occurred during the period of assessment. Higher rainfall can somewhat improve the hydrology of wetlands depressed by pumping (Cameron et al., 2022) and is consistent with the longer time (though not significantly) near normal pool experienced in the more recent sample (Table 1; Figure 6d). Thus, differences between changed and unchanged wetlands could shrink or expand during another period with differing rainfall or pumping conditions. Any simple binary threshold must make assumptions about the representativeness of relevant forcings and the transferability of sample-derived values to individual wetlands (Cameron et al., 2022). Future work could more formally test how differences between ecologically changed and unchanged wetlands vary with rainfall and pumping, building upon Balerna et al.’s (2023) methods.
In support of future work, water level and vegetation data are available via Tampa Bay Water and SWFWMD for considerably more wetlands than in SWFWMD (1999). Newer data are also of higher quality, with better elevation benchmarks and deeper, professionally installed wells (SWFWMD 2022). Although the vast majority of wetlands in the Tampa Bay area have recovered, a notable minority remain impacted (Hogg et al., 2020, Balerna et al., 2024). Future studies may be able to leverage these datasets to develop classifiers using larger sample sizes and additional hydrologic metrics while better accounting for covariates.
Such investigations could also help clarify why the 55 cm Cypress Offset threshold, robust across samples (Cameron et al., 2022), appears to effectively distinguish unchanged condition (Figure 2). Based on typical cypress dome depth morphology, the Cypress Offset requires median water levels to be near or above land surface, functionally serving as a proxy for at least some inundation (as measured at the gage) half the time over the long-term. The breakpoint may then simply detect when water levels spend too much time in the subsurface, a transition made statistically visible by open water and subsurface specific yield differences. Mechanistically, since changed cypress domes can still achieve peak inundation (Figures 4-5), and the hydrologic “breakpoint” occurs near land surface, this suggests that appropriate soil moisture is a key factor in cypress dome health. Soil moisture helps to prevent soil oxidation and subsidence and supports specific growth stages of cypress and other wetland species, although periodic wetland drying is also required for cypress seedling establishment (Casey and Ewel, 2006, Moore Powell et al., 2019, Thurman and Crisman, 2023).
Conclusion
Pumping impacts are not uniform across the water level distribution at cypress domes, with lowest water levels most affected. This is consistent with rainfall-pumping anticorrelation, larger fluctuations when wetland water levels enter the subsurface, and wetland morphology. At wetlands with these pumping impact patterns, environmental levels focusing only on peak inundation metrics could miss ecological degradation. The author hopes that this short case study will spur interest in future work on approaches for lentic environmental flows, which are understudied relative to lotic systems (Arthington et al., 2024).
Acknowledgments
I would like to acknowledge the dedicated staff of SWFWMD and Tampa Bay Water for data collection and numerous technical discussions on pumping impacts over the years, with particular credit to Michael Hancock and David Carr. Sammy Smith (SWFWMD) and Whitney Kiehn (Tampa Bay Water) aided recent data requests. I thank Martin Wilkes and Graham Underwood for discussions during my doctoral research that led to this analysis being developed into a standalone publication. Finally, I thank the three reviewers who provided constructive comments and local expertise that greatly improved the paper.
Funding Information
This study did not receive any specific funding.
Author Contributions
Cortney Cameron: Conceptualization, Analysis, Writing – original draft, Writing – reviewing and editing, Visualization
Data Availability
All data and code can be found here.
Transparent Peer Review
Results from the Transparent Peer Review can be found here.
Recommended Citation
Cameron, C. R. 2026. Asymmetric hydrologic alteration in depressional wetlands: Groundwater pumping disproportionately depresses low water levels in cypress domes. Stacks Journal: 26009. https://doi.org/10.60102/stacks-26009
References
Acreman, M. C., and M. P. McCartney. 2009. Hydrological impacts in and around wetlands. In The Wetlands Handbook, edited by E. Maltby and T. Barker. Wiley-Blackwell.
Arthington, A. H., D. Tickner, M. E. McClain, et al. 2024. Accelerating environmental flow implementation to bend the curve of global freshwater biodiversity loss. Environmental Reviews 32: 387–413. https://doi.org/10.1139/er-2022-0126.
Balerna, J. A., A. M. Kramer, S. M. Landry, M. C. Rains, and D. B. Lewis. 2023. Synergistic effects of precipitation and groundwater extraction on freshwater wetland inundation. Journal of Environmental Management 337: 117690. https://doi.org/10.1016/j.jenvman.2023.117690.
Balerna, J. A., A. M. Kramer, S. M. Landry, M. C. Rains, and D. B. Lewis. 2024. Wetland hydrological change and recovery across three decades of shifting groundwater management. Journal of Hydrology 644: 132052. https://doi.org/10.1016/j.jhydrol.2024.132052.
Bartholomew, M. K., C. J. Anderson, and J. F. Berkowitz. 2020. Wetland vegetation response to groundwater pumping and hydrologic recovery. Wetlands 40: 2609–19. https://doi.org/10.1007/s13157-020-01383-5.
Basso, R., L. LeMond, D. Leeper, C. Cameron, J. Qi, and D. Weinstein. 2020. Northern Tampa Bay Lake and Wetland Status Assessment. Southwest Florida Water Management District.
Bedient, P., M. Brinson, F. Dierberg, et al. 1999. Report of the Scientific Peer Review Panel on the Data, Theories, and Methodologies Supporting the Minimum Flows and Levels Rule for the Northern Tampa Bay Area, Florida. Prepared for the Southwest Florida Water Management District.
Cameron, C. R., M. C. Hancock, D. W. Carr, et al. 2020. Hydroperiods of cypress domes in west-central Florida, USA. Wetlands 40: 2225–34. https://doi.org/10.1007/s13157-020-01329-x.
Cameron, C., D. Leeper, G. Leeper, R. Basso, and T. J. Venning. 2022. Validation of Cypress & Mesic Wetland Offsets for Minimum Wetland & Lake Level Development. Southwest Florida Water Management District.
Cameron, C. R., and T. J. Venning. 2025. Maximum potential age of pondcypress hydrologic indicators using diameter at breast height. Limnological Review 25: 9. https://doi.org/10.3390/limnolrev25010009.
Cameron, C., C. Shea, R. Nowicki, D. Schmutz, J. LaRoche, and M. Hancock. 2023. Hydrology of cypress domes: A review. Wetlands Ecology and Management 31: 673–96. https://doi.org/10.1007/s11273-023-09941-4.
Campbell, D., M. Hancock, and S. Smith. 2020. Revised Minimum Levels Based on Reevaluation of Levels Adopted for 41 Southwest Florida Water Management District Wetlands. Southwest Water Management District.
Casey, W. P., and K. C. Ewel. 2006. Patterns of succession in forested depressional wetlands in north Florida, USA. Wetlands 26: 147–60. https://doi.org/10.1672/0277-5212(2006)26[147:POSIFD]2.0.CO;2.
Condon, L. E., and R. M. Maxwell. 2019. Simulating the sensitivity of evapotranspiration and streamflow to large-scale groundwater depletion. Science Advances 5: eaav4574. https://doi.org/10.1126/sciadv.aav4574.
Cooper, D. J., E. C. Wolf, M. J. Ronayne, and J. W. Roche. 2015. Effects of groundwater pumping on the sustainability of a mountain wetland complex, Yosemite National Park, California. Journal of Hydrology: Regional Studies 3: 87–105. https://doi.org/10.1016/j.ejrh.2014.10.002.
De Graaf, I. E. M., T. Gleeson, L. P. H. (Rens) Van Beek, E. H. Sutanudjaja, and M. F. P. Bierkens. 2019. Environmental flow limits to global groundwater pumping. Nature 574: 90–94. https://doi.org/10.1038/s41586-019-1594-4.
De Graaf, I. E. M., B. Marinelli, and S. Liu. 2024. Global analysis of groundwater pumping from increased river capture. Environmental Research Letters 19: 044064. https://doi.org/10.1088/1748-9326/ad383d.
Emery, J., J. Bays, and B. Ormiston. 2022. Final Peer Review of Cypress Offset/Mesic Wetland Offset Criteria for Proposed Minimum Lake and Wetland Levels. https://www.swfwmd.state.fl.us/sites/default/files/documents-and-reports/reviews/Final%20Peer%20Review%20Report%20of%20Cypress_Mesic%20Wetland%20Offset%2020220719.pdf.
Fligner, M. A., and T. J. Killeen. 1976. Distribution-free two-sample tests for scale. Journal of the American Statistical Association 71: 210–13. https://doi.org/10.1080/01621459.1976.10481517.
Fouad, G., and T. M. Lee. 2021. A spatially distributed groundwater metric for describing hydrologic changes in a regional population of wetlands north of Tampa Bay, Florida, from 1990 to 2015. Wetlands 41: 103. https://doi.org/10.1007/s13157-021-01502-w.
Gilvear, D. J., and C. Bradley. 2009. Hydrological dynamics II: Groundwater and hydrological connectivity. In The Wetlands Handbook, edited by E. Maltby and T. Barker, vol. 2. Wiley-Blackwell.
Gleeson, T., and B. Richter. 2018. How much groundwater can we pump and protect environmental flows through time? Presumptive standards for conjunctive management of aquifers and rivers. River Research and Applications 34: 83–92. https://doi.org/10.1002/rra.3185.
Hancock, M. C., and D. S. Anderson. 1996. Northern Tampa Bay Water Resources Assessment Project. Volume One. Surface-Water/Ground-Water Interrelationships. Southwest Florida Water Management District. https://www.nrc.gov/docs/ML1232/ML12325A443.pdf.
Hancock, M., and D. Leeper. 2023. A Brief History of Minimum Flows and Levels and Reservations Established by the Southwest Florida Water Management District. Southwest Florida Water Management District.
Hogg, W., E. Hayes, D. Keesecker, W. Kiehn, and C. Shea. 2020. Tampa Bay Water Recovery Assessment: Final Report of Findings. Tampa Bay Water.
Lapides, D. A., S. Zipper, and J. C. Hammond. 2023. Identifying hydrologic signatures associated with streamflow depletion caused by groundwater pumping. Hydrological Processes 37: e14877. https://doi.org/10.1002/hyp.14877.
Lee, T. M., K. H. Haag, P. A. Metz, and L. A. Sacks. 2009. Comparative hydrology, water quality, and ecology of selected natural and augmented freshwater wetlands in west-central Florida. U.S. Geological Survey. https://doi.org/10.3133/pp1758.
Metz, P. 2011. Factors That Influence the Hydrologic Recovery of Wetlands in the Northern Tampa Bay Area, Florida. Nos. 2011–5127. U.S. Geological Survey. https://doi.org/10.3133/sir20115127.
Moore Powell, K., J. G. Wynn, M. C. Rains, M. T. Stewart, and S. Emery. 2019. Soil indicators of hydrologic health and resilience in cypress domes of west-central Florida. Ecological Indicators 97: 269–79. https://doi.org/10.1016/j.ecolind.2018.10.008.
Nilsson, K. A., M. C. Rains, D. B. Lewis, and K. E. Trout. 2013. Hydrologic characterization of 56 geographically isolated wetlands in west-central Florida using a probabilistic method. Wetlands Ecology and Management 21: 1–14. https://doi.org/10.1007/s11273-012-9275-1.
Qi, J., T. Venning, C. Joseph, C. Cameron, R. Basso, and D. Leeper. 2024. Reevaluation of Minimum Levels for Lake Verona in Highlands County, Florida. Southwest Florida Water Management District.
SWFWMD. 1999. Northern Tampa Bay Minimum Flows and Levels White Papers—Establishment of Minimum Levels in Palustrine Cypress Wetlands. Brooksville, FL.
SWFWMD. 2022. Guide to District Hydrologic Data. https://www.swfwmd.state.fl.us/sites/default/files/medias/documents/Guide_To_Hydrologic_Data.pdf.
SWFWMD. 2026. Hydrologic data. https://www.swfwmd.state.fl.us/resources/data-maps/hydrologic-data.
Thurman, P. E., and T. L. Crisman. 2023. Response of tree species in cypress (Taxodium spp.) domes of central Florida to a hydrologic gradient. Forest Ecology and Management 537: 120956. https://doi.org/10.1016/j.foreco.2023.120956.
Zhou, T., L. Shu, C. Lu, and B. Liu. 2023. Attenuation of the contribution of groundwater to a wetland caused by groundwater overexploitation. Hydrological Processes 37: e15022. https://doi.org/10.1002/hyp.15022.
Open Access
Peer-Reviewed
Creative Commons
Accepted: 8 July 2026
Published: 17 August 2026
This study did not receive any specific funding.
Conflicts of Interest:
The author declares no conflicts of interest.


