

Seasonal diets, trace minerals, heavy metals, and body condition: nutritional characteristics of barren ground caribou in Southwest Alaska
2 Alaska Department of Fish and Game, Palmer, Alaska, USA
3 Ecology and Genetics Research Unit, University of Oulu, Oulu, Finland
RGJ: https://orcid.org/0000-0002-2604-4533
RS: https://orcid.org/0000-0002-2792-484X
DD: https://orcid.org/0000-0001-7686-740X
JW: https://orcid.org/0000-0002-3865-4822
Jespersen, R. G., R. Sattler, D. Demma, and J. M. Welker. 2026. Seasonal diets, trace minerals, heavy metals, and body condition: nutritional characteristics of barren ground caribou in Southwest Alaska. Stacks Journal: 26007. https://doi.org/10.60102/stacks-26007.

Abstract photo. Conceptual model illustrating the analytical approach to nutrition taken in this study. Environment shapes forage characteristics including nutritional quality and trace element content. Forage characteristics determine diet composition and trace element intake. Diet composition and trace element intake drive stable isotope variation in tissues, trace elements in hair, and body condition (assessed in the MCH only), the metrics we measured. Fitness outcomes were not directly measured.
Abstract
Barren‐ground caribou (Rangifer tarandus granti) are a keystone species in tundra ecosystems experiencing rapid climate-driven habitat changes. Synchronous declines and persistent low numbers in many herds across the circumpolar north have raised concerns about the nutritional and demographic health of caribou populations. We sampled 170 animals from two recognized herds—the Mulchatna and Northern Alaska Peninsula herds—and three non-migratory groups in Southwest Alaska inhabiting areas around Goodnews Bay, Togiak, and Kukaklek Lake, analyzing stable isotopes (δ13C and δ15N) and trace elements in tissues (hair, red blood cells, and serum). We also quantified body fat and protein in lactating and non-lactating females from the Mulchatna herd to assess body condition in the region’s largest migratory herd. Using stable isotope mixing models and isotopic niche reconstructions—the first conducted for Southwest Alaska caribou—we quantified spatial and temporal differences in diet composition. We also assessed nutritional status using key markers such as δ15N and trace element concentrations along with body condition metrics. Our findings demonstrate significant spatiotemporal differences in dietary patterns and nutritional markers across groups. The Northern Alaska Peninsula herd exhibited the broadest isotopic niche and the highest consumption of deciduous shrubs (82% of summer-fall diet), while the Kukaklek Lake group displayed the narrowest niche, lowest δ15N levels, and highest levels of lead. Within the Mulchatna herd, the East subgroup showed elevated δ15N values (0.5-1‰ higher), improved mineral nutrition, and lower cadmium levels compared to the West subgroup. Redundancy analysis (RDA) revealed drivers of isotopic variation at two scales: at the regional scale caribou group was the dominant predictor, while within the Mulchatna herd, subgroup identity, lactation status, and several trace elements (barium, chromium, magnesium, lead) contributed additional fine-scale structure. A third RDA on the Mulchatna herd used body condition metrics—body fat and protein—as response variables and showed that only lactation status was a significant predictor, being negatively associated with body fat; subgroup, trace elements, and heavy metals did not explain variation in body condition within the Mulchatna herd. These results suggest that while subregional differences in forage quality and availability drive measurable variation in isotopic and trace elements in Southwest Alaska caribou, the fitness consequences remain unknown. This study highlights the importance of incorporating integrative dietary and physiological data into long-term monitoring to elucidate the nutritional consequences of environmental change in a rapidly shifting northern landscape.
Keywords: Alaska, body condition, caribou, health indices, diet, isotopes, Mulchatna caribou herd, trace elements
Introduction
Barren-ground caribou (Rangifer tarandus granti) are keystone herbivores in tundra ecosystems and a critical subsistence and cultural resource for many indigenous and rural northern communities (Bali and Kofinas, 2014, Borish et al., 2021, Fall, 2016). Recent declines and sustained low numbers in many herds are creating subsistence and conservation challenges across large parts of their range (Russell et al., 2024, Vors and Boyce, 2009). The synchronicity across populations suggests that climate-driven landscape changes (e.g., decreased tundra and increased shrub biomass, increased frequency of wildfire)—which are accumulating at an unprecedented rate across the Arctic (Box et al., 2019, Buchwal et al., 2020, Wenzl et al., 2024)—may be contributing factors. However, while climate change is undoubtedly impacting caribou (Joly et al., 2011, Mallory et al., 2018), the mechanisms remain uncertain. Other factors, such as density-dependent forage dynamics, anthropogenic development, disease, hunting, and predation, also influence caribou populations seemingly outside of “normal” fluctuations (Albon et al., 2002, Bergerud, 1996, Messier et al., 1988, Vors and Boyce, 2009). Likewise, concerns surrounding caribou resilience and best practices to support declining herds and maintain healthy populations vary widely among stakeholders. Increasingly, there is recognition that individual health and nutrition can help link environmental change to demography in northern ungulates (Rioux et al., 2022b).
As capital breeders, female caribou depend on enough high-quality forage during the warm season to replenish protein and fat reserves lost during the winter and support immune health, pregnancy, and lactation. Nutritional quality of the summer-autumn range is especially critical for female fecundity (Johnson et al., 2022, Mallory et al., 2018) through its influence on body condition (Cameron et al., 2011, Chan-McLeod et al., 1994), pre-winter fat accumulation (Adamczewski et al., 1987, Couturier et al., 2008, Crête and Huot, 1993), and mineral nutrition (Rioux et al., 2022b, Staaland and White, 2001). Similar summer nutrition constraints affect other ungulates, limiting pregnancy rates and survival in elk (Proffitt et al., 2016), black-tailed deer (Parker et al., 1999), mule deer (Monteith et al., 2013), moose (Cook et al., 2021c), and bighorn sheep (Stephenson et al., 2020), with trace mineral deficiencies linked to poor survival in moose (O’Hara et al., 2001) and black-tailed deer (Flueck, 1994). To meet these demands, barren-ground caribou rely on a seasonally dynamic diet that includes large quantities of vascular plants during the growing season and lichens during the snow-covered season (Webber et al., 2022). The abundance and phytochemical profiles of different plant functional types (PFTs; e.g. graminoids versus shrubs) shape range quality (Denryter et al., 2020, Johnstone et al., 2002, Richert et al., 2021). Simultaneously, ecological, environmental, and anthropogenic factors can influence foraging behaviour, predation (Gunn and Miller, 1986), insect harassment (Johnson et al., 2021), industrial infrastructure (Smith et al., 2023), and intraspecific competition (Ferguson et al., 2001) are known to impact foraging ground selection (Johnson et al. 2022).
The foraging landscape in the Arctic and subarctic is also changing rapidly. Tundra “greening” (Mekonnen et al., 2018) through the expansion of erect shrubs (Macander et al., 2022, Mekonnen et al., 2021), declines in graminoids, increases in the frequency of fires (Grabinski and McFarland, 2020) and rain-on-snow events (Pan et al., 2018, Hansen et al. 2019), and increasing moose abundance (Perry, 2023) are all impacting what is available and when it is accessible. Understanding how different herds meet their nutritional needs is therefore vital for effective conservation and management in a period of unprecedented ecological change.
A range of techniques has been employed to analyze caribou diets, including scat microhistology (e.g. Joly et al., 2007, Joly and Cameron, 2018), DNA-based methods (Mitchell et al., 2022, Nagati et al., 2024), direct observation (Denryter et al., 2017, Kuropat, 1984), and stable-isotope analysis of animal tissues (Hiltunen et al., 2026, Zhao et al., 2019). Stable isotopes offer the unique advantage of being time-integrated, such that values from tissues like serum, red blood cells (RBC), whiskers, and hair reflect nutrients assimilated over different temporal windows (Hilderbrand et al., 2011, Hiltunen et al., 2022, Schwertl et al., 2003). Crucially, δ13C and δ15N also serve as proxies for an animal’s trophic niche—the multidimensional space defined by its resource use and ecological role (Newsome et al., 2009, Shipley and Matich, 2020). In consumers δ13C values provide insight into the primary sources of dietary carbon, thus in herbivores δ13C values help distinguish between forage types, as δ13C values vary with photosynthetic pathway and water-use efficiency (e.g., lichens typically have much lower δ13C values than graminoids). δ15N values in consumers often reflect trophic level and may also reflect physiological condition, including nutritional stress (Gustine et al., 2011, 2012). In forage species δ15N varies with protein content and the nitrogen acquisition process employed by the forage species (e.g. mycorrhizal plants have lower δ15N than non-mycorrhizal species; Craine et al., 2009). Thus, major plant functional types (i.e. graminoids versus lichens) occupy distinct positions in δ13C – δ15N space, enabling inferences about trophic niche breadth, spatial variation in foraging, and dietary consistency across individuals or seasons.
Further, while trophic niche, digestible energy, and N content from forage are often the analytical focus in ungulate foraging ecology, essential trace elements such as chromium (Cr), cobalt (Co), copper (Cu), iron (Fe), manganese (Mn), molybdenum (Mo), selenium (Se), zinc (Zn), iron (Fe), magnesium (Mg) are also critical to metabolic health and reproductive success in ungulates (O’Hara et al., 2001, Puls, 1994), with low levels linked to poor individual health and recruitment (O’Hara et al., 2001). By contrast, non-essential heavy metals such as arsenic (As), barium (Ba), cadmium (Cd), and lead (Pb) are toxic (Puls, 1994), with high levels linked to reduced growth, reproductive impairment, and other health effects (Beest et al., 2023). Tissue levels of both essential and toxic elements are known to reflect dietary intake and the geochemical signatures of the landscape, which vary across ecozones and seasons (Gamberg et al., 2020, Oster et al., 2018, Staaland and White, 2001). Thus, trace element profiles derived from caribou tissue can provide complementary ecological and nutritional information (Jutha et al., 2022a, Puls, 1994, Rioux et al., 2022b), allowing us to explore not only nutrient acquisition but also the potential environmental or physiological constraints on caribou foraging with implications for herd health and dynamics.
Here, we present the first stable isotope-based diet reconstruction and isotopic niche analysis for caribou in Southwest Alaska, a region containing the once-abundant Mulchatna herd (MCH)—which has declined ~90% since the 1990s—along with several smaller, less studied groups. We examined three linked components of nutritional ecology (Figure S1): (1) diet composition and foraging niche inferred from δ13C and δ15N in multiple tissues representing distinct seasonal windows, (2) trace element and heavy metal levels measured in hair, which can reflect both access to micronutrients and exposure to potentially toxic elements, and (3) fall body composition in females from the MCH, integrating summer-fall foraging opportunity and lactation costs. We hypothesized that geographically discrete caribou groups would differ in these nutritional indicators, reflecting variability in forage quality across this vast landscape, and that the within-herd subgroups (MCH-East and West) would show corresponding differences in nutritional status. For the MCH specifically, we anticipated that nutritional indicators would correlate with body condition if subregional forage differences were substantial enough to affect individual performance. Such baseline data are urgently needed; understanding how caribou meet their nutritional needs in rapidly changing landscapes is essential for identifying habitat features that support population persistence and for guiding conservation in a warming Arctic.
Methods and Materials
Study area
Our study area encompassed much of Southwest Alaska and a portion of the northern Alaska Peninsula, including the lands bounded by the Kuskokwim River to the north, Bristol Bay to the west, Lakes Clark and Iliamna to the east, and Aniakchak National Monument to the south (Figure 1). The climate in this area is broadly subarctic with long, cold winters and short, cool summers with frequent precipitation; annual weather patterns are heavily influenced by proximity to the marine environment. Landscapes in Southwest Alaska are diverse and include extensive mountains, salmon-bearing streams and rivers, coastal deltas, boreal forest, tundra, peatlands, volcanoes, and large lakes. Likewise, vegetation across the region varies enormously, but generally is a mixture of wetlands, ribbon spruce forests, graminoid and shrub tundra, and lichen heath (Macander et al., 2022).
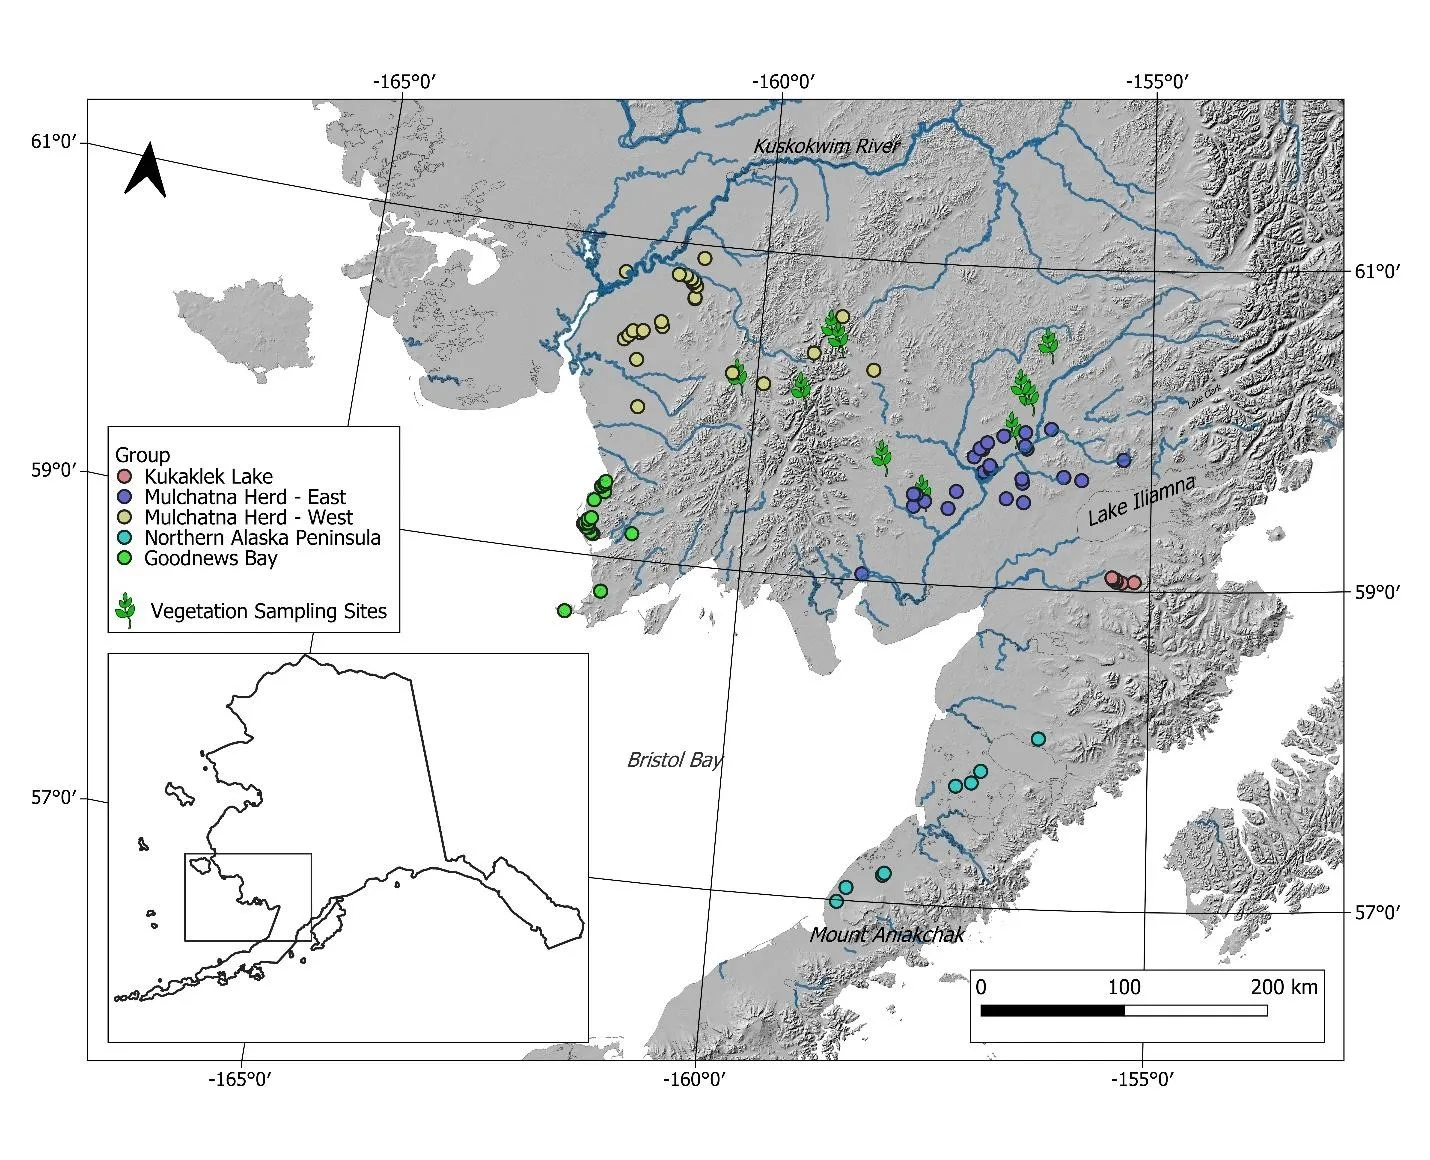
Figure 1. Sample locations in Southwest Alaska. Colored points represent caribou capture locations for individuals assigned to the Mulchatna caribou heard east and west subgroup (MCH-East, MCH-West), Northern Alaska Peninsula (NAP), Goodnews Bay (GB), and Kukaklek Lake (KL) area. Approximate herd boundaries are not available. Vegetation sampling locations are represented by green plant stems with leaves.
Study populations
Caribou occur throughout the region, with state and federal management agencies recognizing three main herds (defined as female fidelity to a calving ground (Skoog, 1968) in the area; the MCH, Nushagak Peninsula, and the Northern Alaska Peninsula (NAP). The MCH is the largest and most historically significant (Murie, 1935, Skoog, 1968) but has declined by ~90% over the past three decades from ~200,000 animals in the late 1990s to ~13,000 animals (Lichwa and Landsiedel, 2024). As abundance declined the MCH’s range contracted revealing spatial substructuring within the herd and two primary groups of migratory animals with spatially distinct calving grounds, divergent migration paths, and seasonal space use (referred to as the East and West subgroups; Barten and Watine, 2020, Demma, 2019, Demma and Sattler, 2022). Despite hunting closures since 2019 and predator control efforts (Alaska Department of Fish and Game, 2016, 2023), MCH numbers have remained low since the early 2000’s, raising questions on overall herd and range health (Demma and Sattler, 2022, Sattler, 2021).
Smaller groups of caribou occur (and calve) elsewhere in Southwest Alaska, but their ecological relationships with the MCH are poorly described. Local indigenous knowledge and collaring efforts over the past three decades indicate groups near Goodnews Bay (GB), Kukaklek Lake (KL), and NAP are resident and inhabit seasonal ranges of these groups mostly discrete from the East and West MCH groups (Valkenburg et al., 2003, Van Lanen et al., 2018). Despite their regional importance, Southwest Alaska caribou remain understudied (Colson et al., 2014) relative to other populations, with little data available regarding their diet, nutritional status, or behavior.
Sample collection and analysis
Caribou sampling
Between October 2020 and March 2023, 170 caribou were captured and sampled at several locations in Southwest Alaska (Figure 1). 116 female caribou were captured and sampled from the MCH, always in October, (60 in 2020, 16 in 2021 (due to equipment delays associated with COVID and severe weather patterns), and 40 in 2022). Smaller numbers of individuals were sampled from areas near GB (March 2023, n=23; April 2022, n=13), KL (February, 2023, n=8), and the NAP (February, 2023, n=10).
Caribou capture and handling was performed in accordance with the Alaska Department of Fish and Game (ADFG) Division of Wildlife Conservation protocol (Alaska Department of Fish and Game 2020) and approved by the ADFG Institutional Animal Care and Use Committee (IACUC Nos. 0102-2020-61, 0102-2021-51, 0102-2022-054). Because our study sought to evaluate seasonal diets and indices of health in mature females, we avoided capturing juvenile animals (< 2 year old), which are generally visually distinguishable from older animals, and confirmed this with dentition (Miller, 1972).
Caribou were chemically immobilized by aerial darting from a Robinson R-44 helicopter with 5.0 mg of thiafentinal (Wedgewood Pharmacy, USA) and 70 mg of xylazine hydrochloride (Wedgewood Pharmacy, USA) injected through a 1.5-cc barbed dart fired from a projector rifle (model 196, Pneudart, Williamsport, PA, USA). Immobilized caribou were placed in ventral recumbency, masked, given supplemental oxygen (1-1.5 liters/min), and heart rate, respiration rate, and rectal temperature monitored throughout sedation. Following sample collection, chemical immobilization was reversed by administering 10.0 mg of naltrexone (Wedgewood Pharmacy, USA) per 1.0 mg of thiafentinal injected intramuscularly, and 1.0 mg of atipamizole (Wedgewood Pharmacy, USA) per 10 mg of xylazine, one half given intravenously and one half intramuscularly.
For all caribou, hairs (including root) were plucked from the shoulders, and blood was drawn from the saphenous or jugular vein into a non-additive vacutainer blood tube and centrifuged (15 mins at 3000 – 3500 rpms) to separate serum and red blood cells. Spun blood tubes were frozen at -80 °C until stable isotope analysis. By sampling multiple caribou tissues at two capture periods (fall and late winter), diet estimation through isotopic signatures can be generated for multiple seasonal windows (Table 1).
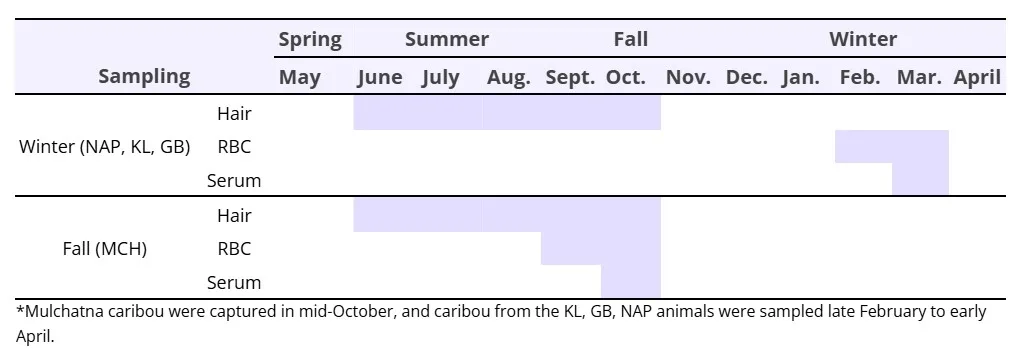
Table 1. Conceptual diagram showing the general seasons the isotopic signatures from caribou hair, red blood cells, and blood serum represent depending on the timing of caribou sampling. For example, serum from winter captures reflects diet in March, whereas serum from fall captures represents diet in October. Caribou were sampled from the Mulchatna caribou herd (MCH), Northern Alaska Peninsula herd (NAP), and the Kukaklek Lake (KL) and Goodnews Bay (GB) areas, all in Southwest Alaska.
While under sedation Mulchatna caribou underwent additional sampling as part of a complementary study to estimate body condition (n=102) following protocols from Cook et al. (2021a). In brief, these caribou were placed in a net and weighed, assigned a body condition score based on palpation and prominence of skeletal features, and ultrasound-derived measurements of rump fat and loin thickness were collected (Ibex Pro ultrasound, 5-9 MHz linear probe, E.I. Medical Imagine, Loveland, CO, USA). Females were evaluated for evidence of lactation and were considered lactating if milk could be manually expressed from any teat and non-lactating if no milk could be expressed; calf presence near capture sites was also considered. Five caribou appeared to be ceasing lactation (4 in MCH-West, 1 in MCH-East) with a semi-clear fluid extractable from at least one teat, and were excluded from analysis. Caribou body condition metrics (i.e., weight, body condition score, ultrasound measurement of loin thickness and rump fat) were combined to calculate percent ingesta-free body fat (body fat, corrected for body size) and protein (kg) using published equations (Cook et al., 2021a).
Forage sampling
Accurate estimates of the isotopic composition of potential diet items are critical to stable isotope-based diet analyses. At the time of the study, isotopic data from forage species in Southwest Alaska were unavailable. Thus, to improve the accuracy of our mixing models, forage samples were collected within the MCH range twice during the study. The first collection, in late May 2021, was opportunistic and occurred during green-up, and included six sites near the MCH calving grounds, where vegetative samples (new growth and previous year) of known forage species were collected (n=36 individual samples, Table S1).
We performed a more systematic collection between June 21 and June 23, 2022 to capture the full range of isotopic variability in potential forage species during the peak growing season. We manually selected four survey blocks in the west and east MCH summer range. Blocks were 40 m width and variable length, depending on considerations of terrain and vegetation heterogeneity, to constrain sampling logistics to feasible areas that captured a wide range of variation in plant community composition, structure, and associated environment. Within each survey block, we selected three sites (12 total) according to a stratified random design where each site occurred within a different vegetation type according to classified foliar cover maps (Nawrocki, 2021). At each site, 12.5 m radius plots were established, and samples of each vascular plant species and forage lichen (leaves or lichen tissue) were collected within the plot, for a total of 147 individual samples. In total, our two sampling campaigns yielded 184 individual forage samples representing 101 species and 70 genera (Table S1).
Sample processing
Initially, we analyzed hairs using two approaches: whole hairs (2020-2021) and segmented hairs (2022) split into proximal and distal segments to evaluate whether finer temporal resolution was achievable (Rogers et al., 2020, Schwertl et al., 2003). However, because the segmented hairs exhibited minimal intra-hair isotopic variation and caribou hair growth rates remain poorly characterized, we ultimately aggregated all samples to whole-hair values using mass-weighted means. All subsequent analyses use these whole-hair values, referred to simply as “hair.”
Hairs were cleaned in a 2:1 chloroform: methanol solution for 24 h and rinsed with deionized water 3-5 times to remove surface oils and debris. Cleaned hairs were oven-dried at 50 °C for 24 hours. Blood components were freeze-dried for 48 h and ground to a fine powder with a ball mill (Mini Beadbeater-16, Biospec Products Inc., Bartlesville, OK). Likewise, individual forage samples (n=183 total) from both sample campaigns were dried at 60°C for a minimum of two weeks, after which each sample was ground to a fine powder.
Subsamples of caribou hair, blood serum, red blood cells and forage were analyzed for N (%), C (%), δ13C, and δ15N with an elemental analyzer (model 4010, Costech Analytical, Valencia, CA, USA) linked to a continuous flow isotope ratio mass spectrometer (model DeltaPLUS XP, Thermo-Finnegan Scientific, Waltham, MA) at the University of Alaska-Anchorage.
A subset of hairs was cleaned according to Jutha et al. (2022b) and analyzed for the essential trace elements chromium (Cr), copper (Cu), iron (Fe), molybdenum (Mo), magnesium (Mg), manganese (Mn), selenium (Se), and zinc (Zn) as well as the toxic heavy metals arsenic (As), barium (Ba), cadmium (Cd), and lead (Pb) at the University of Idaho’s Analytical Science Laboratory (Moscow, Idaho).
Statistical analysis
Isotope status
We compared the isotope status (δ15N and δ13C values) among caribou groups in red blood cells, serum, and hair using one-way ANOVA models. Residuals were assessed for normality and homoscedasticity. All analyses were performed using R 4.5.0 (R Core Team, 2025). Post-hoc means separation was performed using the Tukey HSD test in the emmeans package (Lenth, 2021).
Isotopic niche space
We quantified isotopic niche breadth and overlap among caribou herds for each isotopic time window using SIBER (Stable Isotope Bayesian Ellipses in R package version 2.1.9; Jackson et al., 2011). Bayesian posterior ellipse areas (SEAB) were estimated by fitting bivariate normal distributions to δ13C and δ15N data using Markov Chain Monte Carlo (2 chains, 20,000 iterations, 1,000 burn-in, thinning = 10) with Inverse Wishart priors on covariance matrices and vague normal priors on means. SEAB represents the posterior distribution of the standard ellipse area, containing approximately 40% of the data and representing the core isotopic niche. Pairwise niche overlap was calculated using the “bayesianOverlap” function with p.interval = NULL (40% core ellipses) and 100 posterior draws. We report 95% credible intervals for SEAB and proportional overlap (overlap area / ellipse area × 100).
Diet estimation
We estimated seasonal diet composition using three tissues (i.e., hair, red blood cells, serum) to capture different temporal windows (Table 1). In cervids, hair is shed at the end of the cold season and new growth occurs during the warm season, thus isotopic values of hair integrate caribou diets from early summer through fall (Cuyler and Øritsland 2002, Table 1). Blood components reflect shorter windows: serum integrates forage consumed during the previous 7-10 days while red blood cells integrate the past 1-2 months (Lecomte et al., 2011, Rioux et al., 2020, Tieszen et al., 1983).
Diet source selection directly influences stable isotope mixing model (SIMM) predictions. Because plant functional types (PFTs) in this landscape share biochemical traits that shape their isotopic profile (Jespersen et al., 2018, Welker et al., 2005), we aggregated our forage isotope data by PFT (Figure S2) and sampling period (May, 2021 or late June, 2022). May 2021 PFT groups were fungi, lichen, graminoid, and deciduous shrubs + moss. June 2022 PFT groups were lichen, graminoid, shrub, forb, and spore-bearer (e.g. Equisetum spp. and ferns). We did not collect fungi during June 2022 sampling, but because fungi are a known caribou food item (Druckera et al., 2010) we used plausible values from fruiting body samples collected in a similar landscape in Finland (T.M. Hiltunen, unpublished data) in our mixing models.
Mixing models assume isotopic values primarily reflect diet, but physiological and environmental factors can also influence isotopes—for example, lactation status (Gustine et al., 2012), sampling year, and trace-element or heavy-metal levels (Rioux et al., 2022b; see below). Modern Bayesian techniques can accommodate some of these additional variance sources, but because our primary interest was group-level dietary differences we first evaluated whether lactation and year might confound interpretation. We tested for differences in isotope values among years and between lactating and non‑lactating MCH females using additive linear models with year and lactation status treated as categorical predictors. Although a few comparisons reached statistical significance, the modeled effect sizes were generally small compared with background variation in diet sources and population isotope values (Figures S2 and S3). Also, because we lacked repeated measures on individuals, we could not separate individual‑level from interannual variation or definitively attribute isotopic shifts to lactation versus diet. Consequently, we pooled years and lactation status for diet analyses.
Dietary proportions were estimated using concentration-dependent Bayesian stable isotope mixing models in MixSIAR (Stock et al., 2018). Models were fit using generalist priors. We evaluated the use of informative priors from West Arctic Herd diet estimates ( Joly et al., 2015, Joly and Cameron, 2018) but those priors matched our data poorly, used different forage categories, and produced poor convergence (Gelman-Rubin and Geweke diagnostics), so we retained generalist priors. Tissue‑specific isotope discrimination factors (TDFs) were: hair, δ13C = 2.61‰ and δ15N = 4.23‰ (Rioux et al., 2020); RBC, δ13C = 3.7‰ and δ15N = 2.5‰ (Halley et al., 2010); serum, δ13C = 3.34‰ and δ15N = 5.02‰ (Rioux et al., 2020).
For each tissue collected we estimated diet proportions using caribou group (KL, NAP, GB, MCH-East, and MCH-West) as a random effect, allowing us to simultaneously estimate at the population and group levels. Posterior distributions and the Gelman-Rubin and Geweke diagnostics were all used to confirm model convergence.
Trace elements and heavy metals
We compared hair trace element and heavy metal levels among Southwest Alaska groups using ANOVA models for censored data (datasets with non-detects) from the NADA2 R package (“cenanova” function; Julian and Helsel, 2021) followed by a Tukey’s multiple comparison test for means separation. To evaluate potential biological relevance, values were compared with published values from mountain and woodland caribou (Jutha et al., 2022a, Rioux et al., 2022).
Factors influencing isotopic variation and body condition
While our mixing models (above) estimate dietary proportions from isotopic signatures, substantial variation in δ13C and δ15N values can remain among individuals with similar inferred diets due to physiological state, environmental context, and nutritional status. To identify factors contributing to isotopic variation beyond isotope-inferred dietary composition, we used redundancy analysis with hair samples (RDA; following methods in Rioux et al., 2022b) at two spatial scales: 1) an all-groups analysis to evaluate broad-scale geographic patterns, and 2) a MCH-only analysis to examine finer scale variation in this herd. We conducted an additional RDA within the MCH to test whether the same predictors explained variation in body composition (body fat and body protein). Both analyses were performed using the vegan package (Oksanen et al., 2022) in R.
For the all-groups RDA, we included geographic group (KL, NAP, GB, MCH-East, and MCH-West) and trace element concentrations as predictors of hair δ13C and δ15N. For the MCH-only isotope RDA we included subgroup (East vs. West) and lactation status (lactating vs. non-lactating), and the same suite of trace elements as predictors; the response variables were again δ13C and δ15N. The MCH-only body condition RDA used the same predictor set but with IFBF and total body protein as response variables. For all RDAs, trace elements with high levels of non-detects were excluded from the analysis; these were As, Cd, and Mo. All predictor variables were centered and standardized prior to analysis. Multicollinearity among predictors was assessed using variance inflation factors (VIF); in the all-groups RDA only Manganese exceeded 5 and was excluded from the final model. In both MCH-only RDAs no variables exceeded VIF = 5. The significance of the overall model, individual axes, and predictor variables was assessed via permutation tests (n = 999 permutations).
Body condition
Using published equations in Cook et al. (2021a), we combined body condition indices (i.e., weight, body condition score, ultrasound measurement of loin thickness and rump fat) to calculate body fat (%) and protein (kg). Individuals where body mass was not collected were assigned the mean mass from females captured in the same year to allow full calculation of body composition metrics. We evaluated differences in body fat and protein using two‑way ANOVA models with lactational status (lactating vs. non‑lactating) and herd subgroup (MCH‑East vs. MCH‑West) as fixed effects, including their interaction. Model assumptions were assessed using residual diagnostics, and body fat was log-transformed to meet ANOVA assumptions regarding residual normality and homoscedasticity. We compare our measures of caribou body fat estimates to categories of nutritional limitations ranging from severe (< 6%), moderate (6-9%), mild (> 9 – 12%), or little-to-none (>12%) developed from captive elk nutritional studies that linked body composition metrics to fitness performance measures (Cook et al. 2004) and have been used to describe the nutritional condition of free-ranging moose (Cook et al. 2021a).
Results
Group isotope status and niche space
Caribou groups differed in δ15N and δ13C status in all tissues and sampling periods (Figure 2). Caribou from the NAP group tended to be lowest in δ13C, while caribou from the KL displayed the lowest δ15N values. During all seasons where data was available the MCH-East displayed higher δ15N (0.5-1 1‰) values than the MCH-West.
The isotopic niche breadths of Southwest Alaska caribou varied across groups and seasons (Figures 3 and S4). The NAP consistently exhibited the broadest isotopic niche, with median SEAB values ranging from 2.7 to 6.4, while the KL group maintained the narrowest niches (0.11–0.28). Niche breadth tended to be lowest during the winter and higher in the summer-fall. The MCH-East and West groups’ isotopic niche breadths were indistinguishable during all seasons.
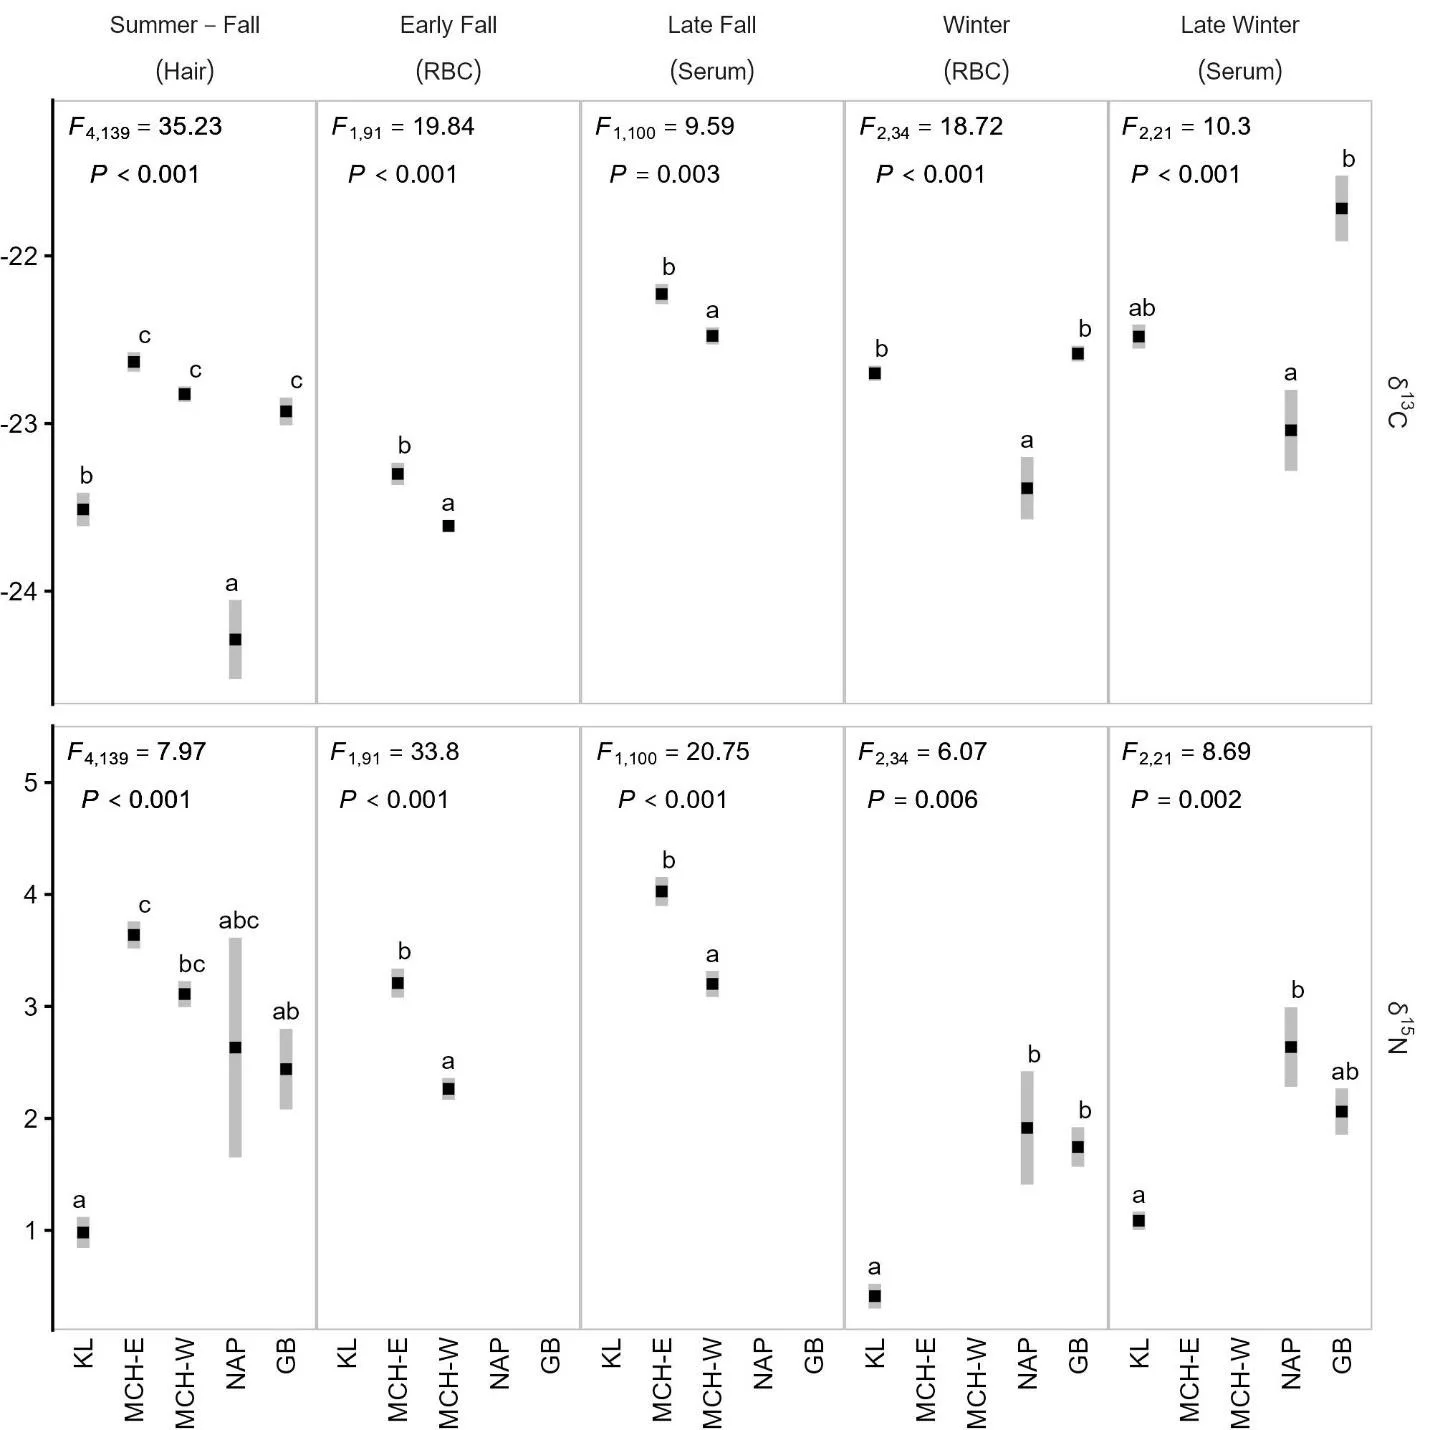
Figure 2. Stable isotope levels (δ15N and δ13C) in red blood cells (RBC), serum, and hair from the Mulchatna caribou herd east and west subgroups (MCH-E and MCH-W), Northern Alaska Peninsula herd (NAP) and Goodnews Bay (GB), and Kukaklek Lake (KL) area. Values are displayed as mean ± SE. ANOVA statistics are inset at the top of each panel. Different letters indicate significant differences among groups at the P < 0.05 level.
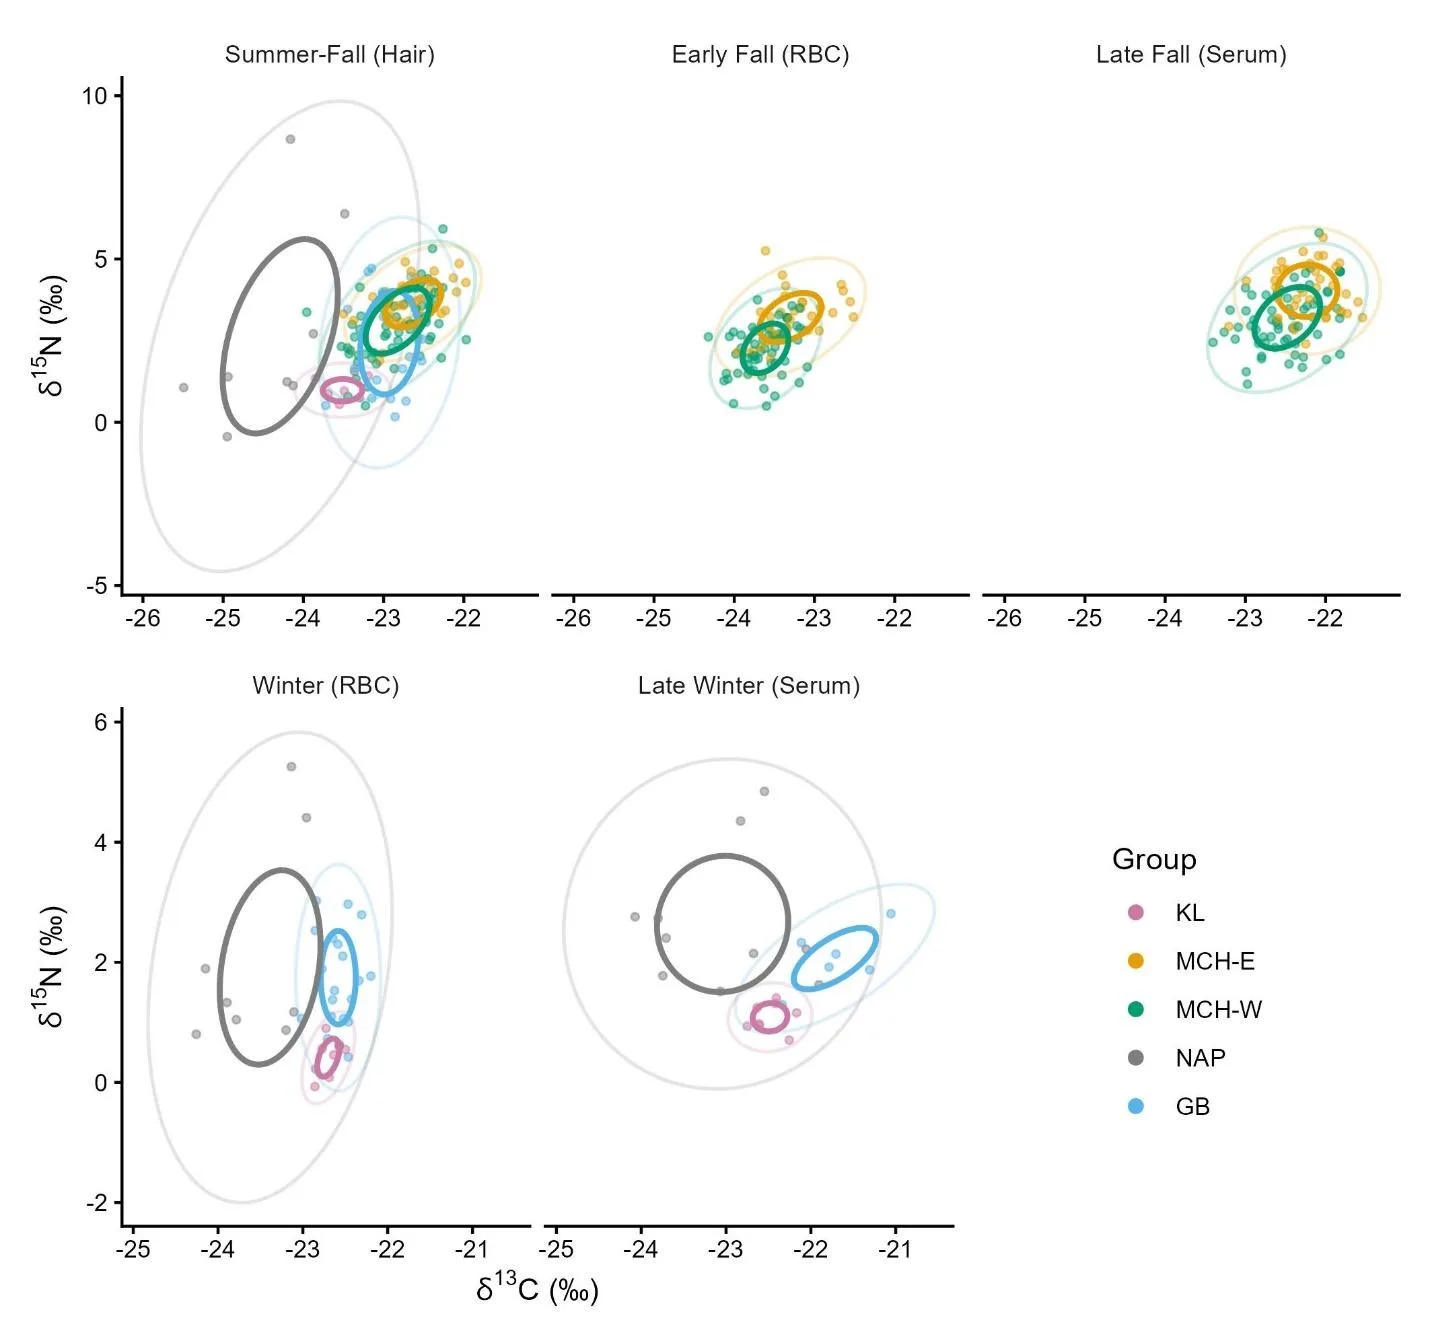
Figure 3. Isotopic niche spaces of Southwest Alaska female caribou 2020 – 2023 by season from 2020 - 2023, including individuals from the Mulchatna caribou herd east and west subgroups (MCH-E and MCH-W), Northern Alaska Peninsula herd (NAP), and Goodnews Bay (GB), and Kukaklek Lake (KL) areas. Points show individual δ13C and δ15N values (‰). Solid ellipses denote corrected standard ellipse areas (SEAc, 40% probability), representing the core isotopic niche. Faint ellipses show 95% prediction ellipses for context. Ellipse areas are expressed in permille squared (‰2), reflecting the dispersion of δ13C and δ15N values.
Isotopic niche overlap among the groups varied between groups and seasons (Figure 3). Overlap of the core ellipses was negligible in winter, with median values near zero, but increased during summer and fall. In the summer through fall period, the strongest overlap occurred among GB, MCH-E, and MCH-W, with median overlap proportions reaching 36%, indicating substantial similarity in isotopic space. In contrast, NAP’s broad niche showed little overlap with other herds, and KL’s narrow niche overlapped minimally with other groups.
Diet
Diet estimates from MixSIAR indicated that Southwest Alaska caribou groups shifted their diet substantially throughout the year, differed in their dietary preferences during some seasons, and consumed unequal proportions of diet items during all periods (Figure 4). We describe diets by broad seasons across tissue types (Table 1).
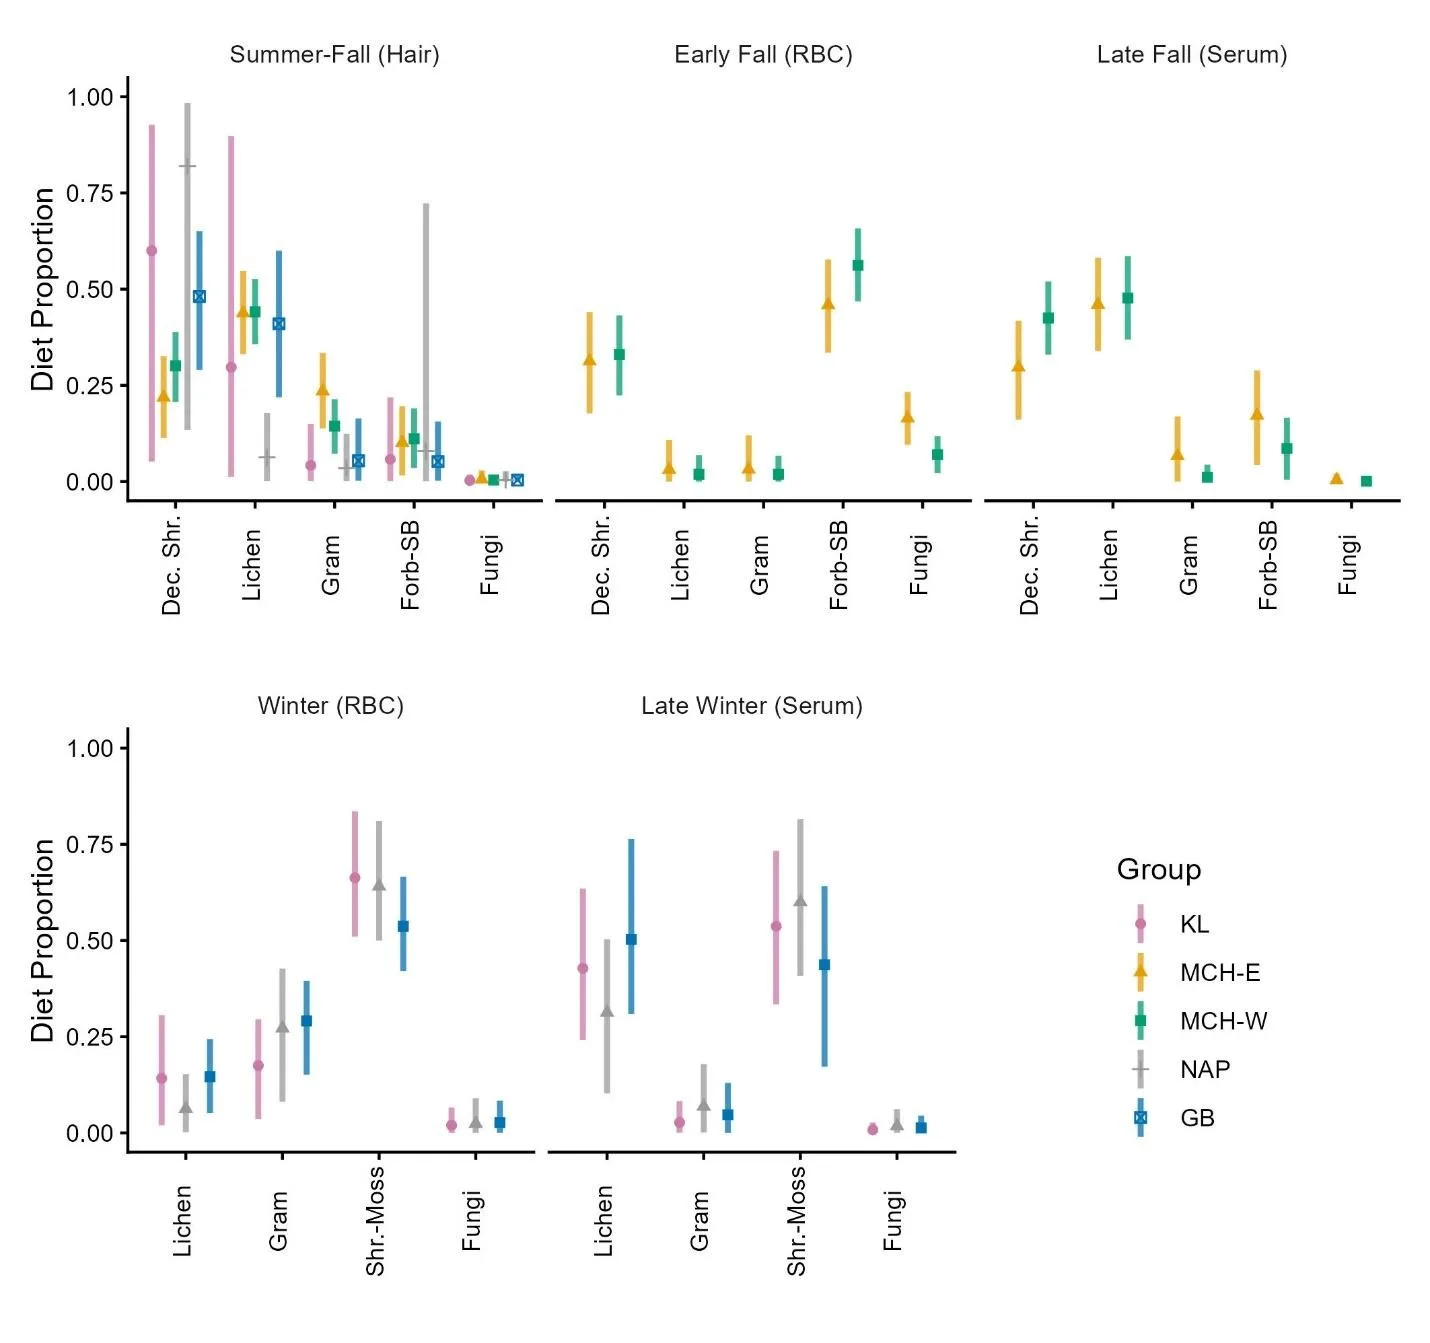
Figure 4. Group-level diet estimates for Southwest Alaska caribou, 2020-2023. Bars are median ± 95% credible interval for proportional contribution of each diet item estimated in MixSIAR. Bars are colored by group. Summer through fall estimates are derived from hair, late summer through early fall estimates from red blood cells, and late fall estimates from serum from October sampling. Winter and late winter diet estimates are derived from blood and serum from late February through early April sampling.
Summer – Fall
During summer and early fall (reflected by hair, Table 1), deciduous shrubs dominated caribou diets, comprising 46% (95% CI: 19–71) of the assimilated diet, followed by lichens (32%, 95% CI: 11–58), graminoids (12%, 95% CI: 2–30), and forbs and spore-bearers (11%, 95% CI: 2–31); fungi were negligible (<1%, Figure 4). Group-specific estimates revealed strong dietary differences during this period but all included considerable amounts of lichen during the growing season. The NAP herd consumed markedly more deciduous shrubs (82%) relative to other groups, although high individual variation led to high uncertainty (95% CI: 13–98), while GB displayed a balanced diet of deciduous shrubs (48%, 95% CI: 29–65) and lichens (41%, 95% CI: 22–60). KL also relied primarily on deciduous shrubs (60%, 95% CI: 5–93) followed by lichens (30%, 95% CI: 1–90), albeit with high uncertainty in estimates for both items. In contrast, the MCH subgroups showed more balanced diets: MCH‑East consumed modest amounts of deciduous shrubs (22%), yet with more lichens (44%) and slightly more graminoids (24%), whereas MCH‑West consumed more deciduous shrubs (30%), but with more lichens (44%) and less graminoid input (14%). No consumption of fungi was detected in any caribou groups in the summer-fall period (Figure 4).
Fall
In early fall (represented by RBC from the MCH subgroups), forbs and spore bearers became the dominant diet items, constituting 42% (95% CI: 10-67) of the overall (both subgroups) assimilated diet, followed by deciduous shrubs (32%, 95% CI: 8%-59%, Figure 4). Diet composition was similar in the MCH-East and MCH-West, except that the MCH-East subgroup consumed more fungi (17% and 7%, respectively). By late fall (reflected in serum from the MCH subgroups), there were no detectable dietary differences between the subgroups, and lichens and deciduous shrubs were again the primary diet items, comprising 35% (95% CI: 5-67) and 31% (95% CI: 5-63) of the overall assimilated diet, respectively.
Winter
During winter (reflected by RBC from caribou captured in late February – early March, 2022, Table 1), shrub-moss dominated diets of KL, NAP, and GB caribou, comprising 56% (95% CI: 23-76) of the assimilated diet, followed by smaller quantities of graminoids (27%, 95% CI: 9-52) and lichens (14%, 95% CI: 3-35, Figure 4). In late winter (reflected by serum from the same captures), lichens became more prominent, constituting 41% (95% CI: 14-69) of the assimilated diet, although shrub-moss remained the single largest diet component, constituting 49% (95% CI: 16-74). No measurable differences in dietary preference were detected across caribou groups during winter.
Trace elements and heavy metals
Trace element concentrations differed significantly among the Southwest Alaska caribou groups for Cr, Cu, Fe, Se, Zn, and Mg (Figure 5). The most pronounced group difference was in Cr, which was more than two times higher in the MCH-West than MCH-East and three times higher than in the KL, NAP, and GB groups. Differences in Cu, Fe, Se, Zn, and Mg between some groups were smaller in magnitude but still statistically supported. Trace element levels in Southwest Alaska caribou generally fell within ranges reported from hair samples in other caribou populations (Jutha et al., 2022, Rioux et al., 2022).
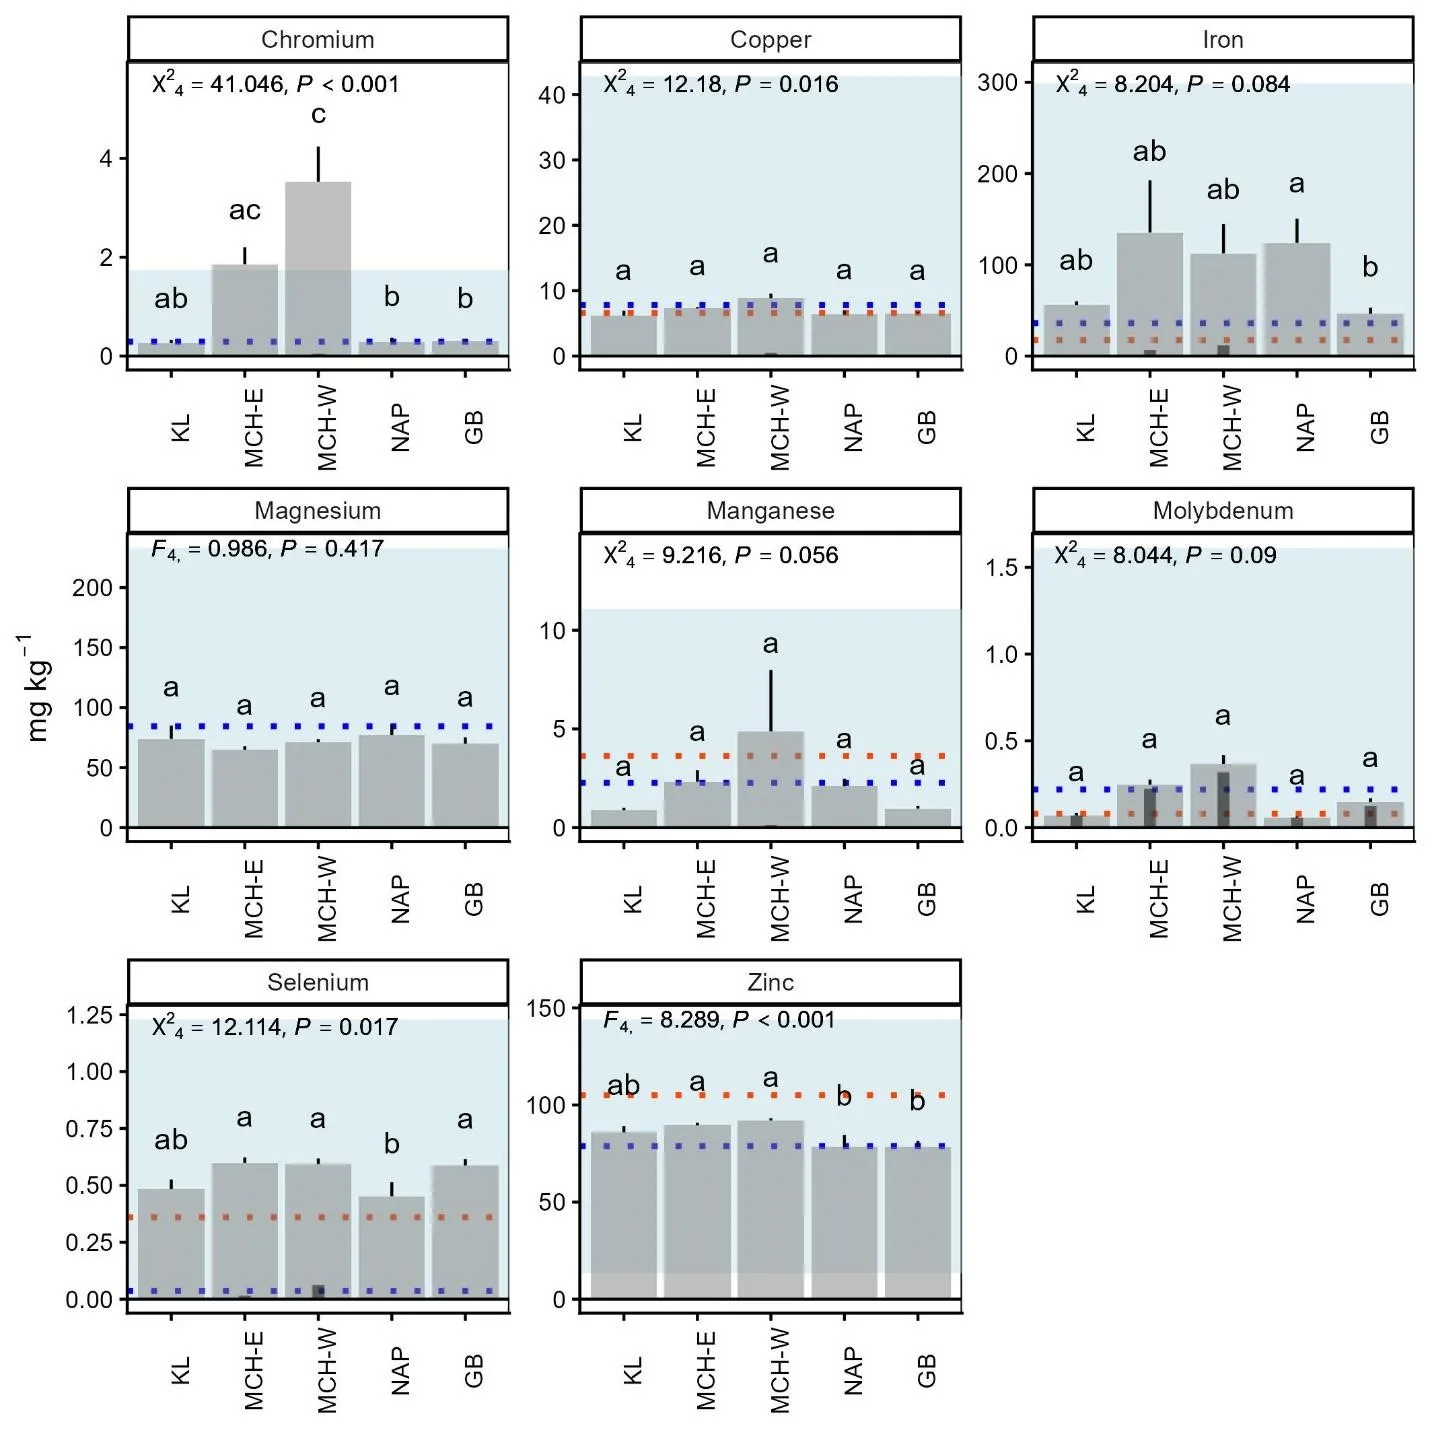
Figure 5. Comparison of trace mineral levels in hair from adult female caribou from the Mulchatna caribou herd east and west subgroups (MCH-E and MCH-W), Northern Alaska Peninsula herd (NAP), and Goodnews Bay (GB), and Kukaklek Lake (KL) area in Southwest Alaska. Large grey bars display as mean + SE. The inset darker bars represent the proportion of values that fell below detection limits, where the height of the larger bar represents a proportion of 1, thus bars without any inset bars (e.g. Mg) did not have any values below detection limits. Groups with different letters are significantly different at the P < 0.05 level. Test statistics (F-ANOVA, χ2-ANOVA for censored data) are inset. The blue dashed line and shaded area represent mean ± SD from Rioux et al. (2022) for mountain caribou (note: the lower limit for the shaded area is zero). The orange dotted line is the mean value reported in Jutha et al. (2022) for woodland caribou.
We found significant differences in levels of Ba, Cd, and Pb among groups (Figure 6). Cd levels in the MCH-West group were exceptionally high, exceeding other groups’ levels by at least 2x; although there were large proportions of animals that fell below detection limits in all groups. Likewise, there was high intergroup variation in Pb levels; the KL group displayed the highest Pb levels, followed by the GB group. Detectable levels of As were found in all caribou groups, although there was a large proportion of non-detects and no differences between groups were observed. Heavy metal concentrations showed substantial variation relative to levels reported in other caribou populations (Jutha et al., 2022a, Rioux et al., 2022) with MCH-West Cd levels elevated compared to published values.
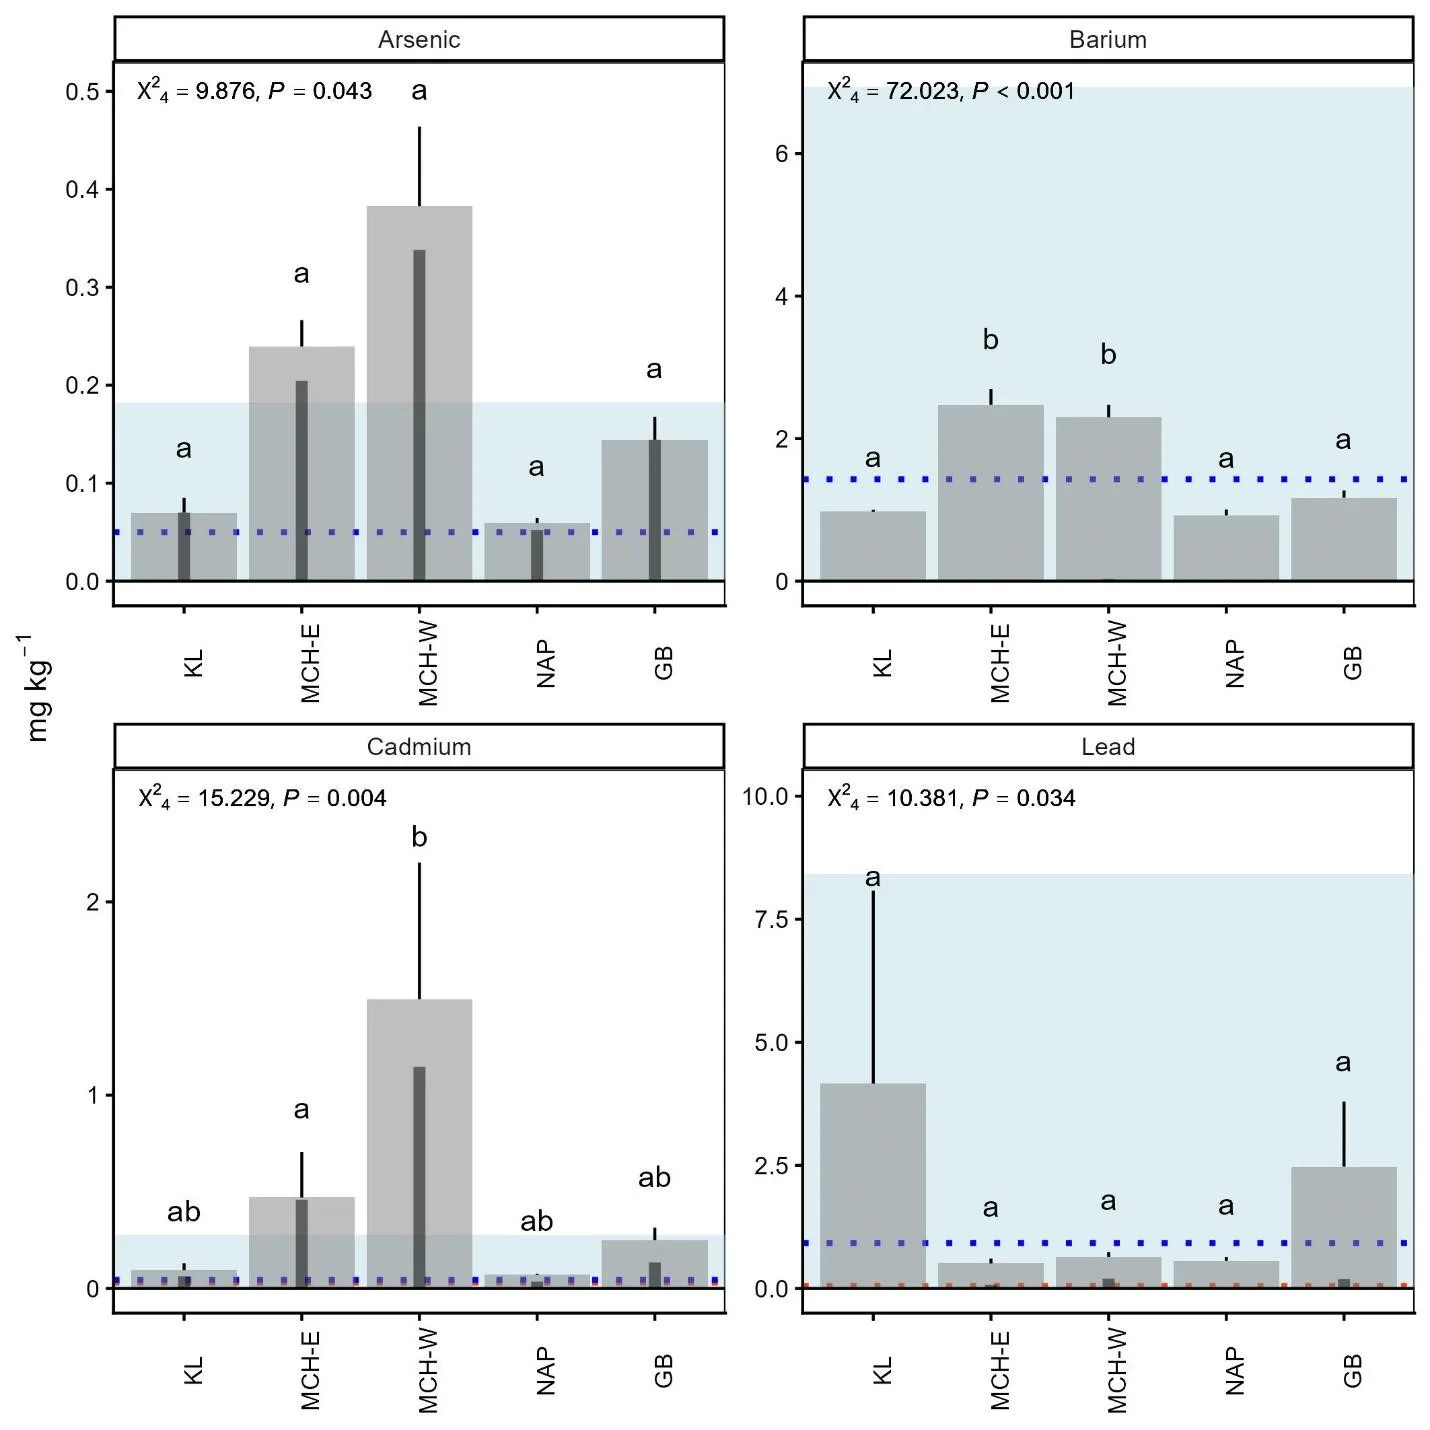
Figure 6. Comparison of heavy metal levels of arsenic, barium, cadmium, and lead in hair from adult female caribou from the Mulchatna caribou herd east and west subgroups (MCH-E and MCH-W), Northern Alaska Peninsula herd (NAP), and Goodnews Bay (GB), and Kukaklek Lake (KL) area in Southwest Alaska. The inset darker bars represent the proportion of values that fell below detection limits, where the height of the larger bar represents a proportion of 1, thus bars without any inset bars (e.g. Ba) did not have any values below detection limits. Groups with different letters are significantly different at the P < 0.05 level. Test statistics (F-ANOVA, χ2-ANOVA for censored data) are inset. The blue dashed line and shaded area represent mean ± SD from Rioux et al. (2022) for mountain caribou (note: the lower limit for the shaded area is zero). The orange dotted line is the mean value reported in Jutha et al. (2022) for woodland caribou.
Factors influencing isotopic variation in the MCH
The RDA revealed a clear hierarchical structure in the drivers of isotopic variation. At the broadest scale, the all-groups RDA showed a strong multivariate relationship between isotopic composition and the set of explanatory variables (Figure 7, overall model: F = 7.52, P = 0.001), with the overall model explaining 44.1% of the total constrained variance. RDA1 accounted for most of the explained variation (eigenvalue = 0.659), whereas RDA2 contributed a smaller proportion (eigenvalue = 0.223). Among the predictors, group showed the strongest association with isotopic variation (Table S2; F = 3.29, P = 0.059), driven by MCH-East animals aligning with higher δ15N values, while the KL and NAP groups aligned with lower δ15N and δ13C values, respectively. Only Cr approached significance at this scale (F = 3.28, P = 0.051), but it explained minimal variance (~4%). All other elements (Ba, Cu, Pb, Se, Zn, Fe, Mg) had low F‑values and high P‑values, indicating limited explanatory power relative to group.
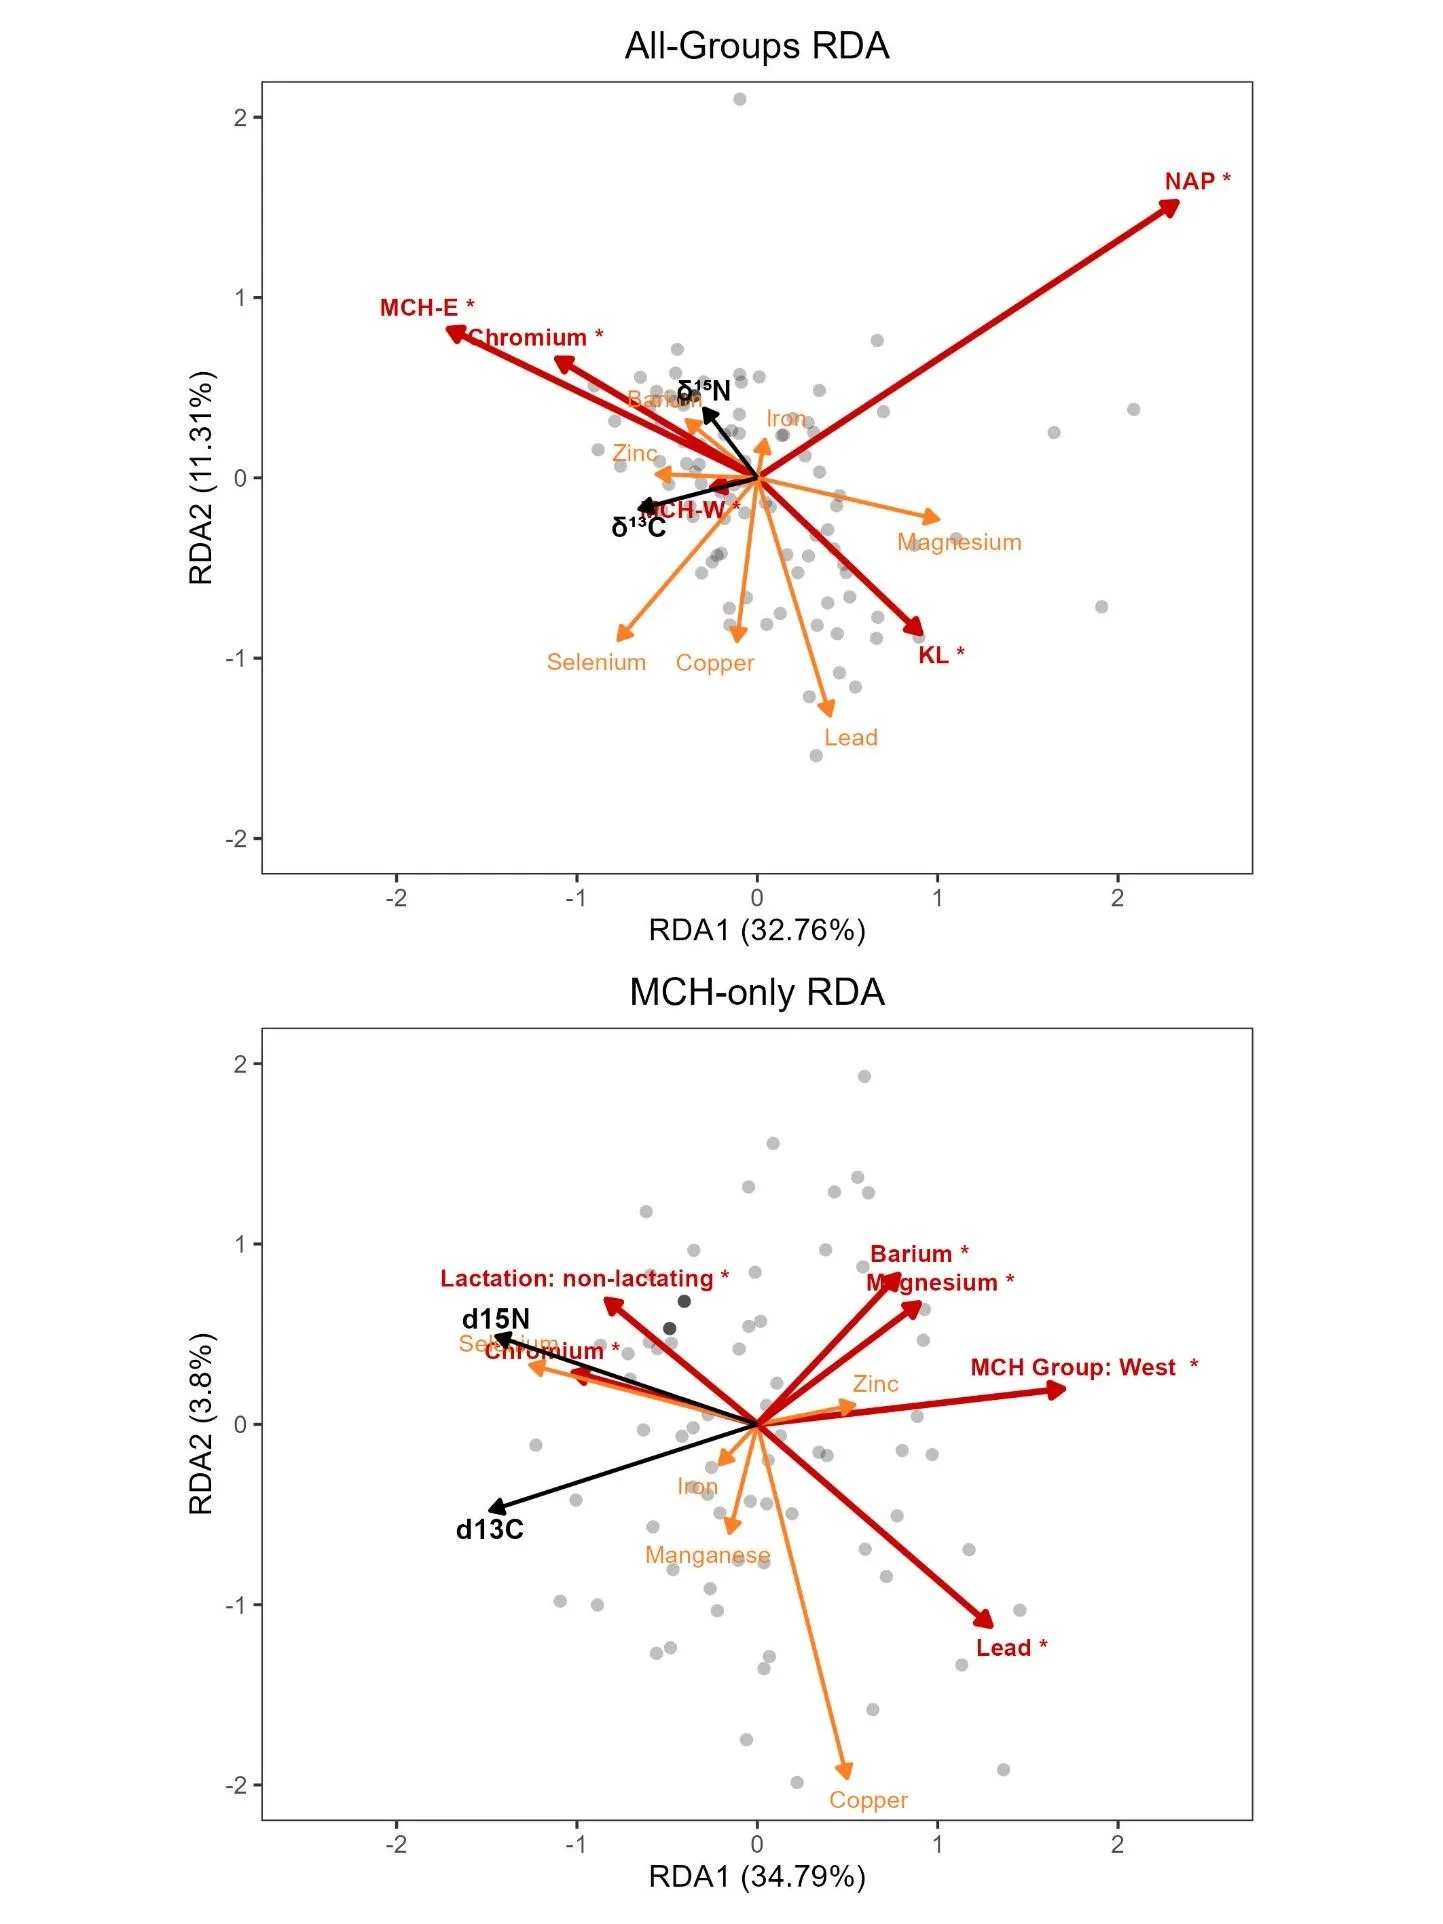
Figure 7. Redundancy analysis (RDA) ordination tri-plots relating carbon (δ13C) and nitrogen (δ15N) stable isotopes to ecological, lactation, and nutritional covariates in female caribou from the Mulchatna caribou herd east and west subgroups (MCH-E and MCH-W), Northern Alaska Peninsula herd (NAP), and Goodnews Bay (GB), and Kukaklek Lake (KL) area. Top: All-groups RDA tri-plot relating δ13C and δ15N to trace mineral levels and group. Bottom: MCH-only RDA tri-plot relating δ13C and δ15N to trace mineral levels, caribou group, and lactation status. Dots represent individual caribou hair samples. Black arrows indicate the response variables (δ13C and δ15N), and covariate predictors are shown as orange lines, with red lines indicating statistically significant predictors (P < 0.05). The lengths of all covariate lines have been multiplied by 3 for visual clarity.
The MCH‑only isotope RDA revealed additional fine‑scale structure (Figure 7, overall model: F = 3.71, P = 0.001) in drivers of isotopic variation and explained 39% of the total constrained variance. Subgroup was the strongest predictor of isotopic variation (Table S3; F = 11.76, P = 0.001), with MCH‑East animals aligning with higher δ15N values. Lactation status also contributed significantly (F = 4.22, P = 0.031), with lactation associated with lower δ15N. Several trace elements—Ba, Cr, Mg, and Pb—were significant predictors within MCH (all P ≤ 0.046), each explaining variance comparable to or slightly below that of lactation. Notably, Pb approached significance (P = 0.51) and was associated with lower δ15N, while Cr was linked to higher δ15N.
In contrast, the MCH-only body condition RDA was significant (F = 2.74, P = 0.003) but explained less of the total constrained variance (32%) and showed that only lactation status significantly predicted variation in body fat and body protein (Table S3; F = 16.99, P = 0.001). Subgroup was not a significant predictor of body condition (F = 0.05, P = 0.955), nor were any of the trace elements or heavy metals (all P > 0.07).
Body condition
Overall the mean mass of adult females from the MCH was 108.7 kg ± 9.4 SD. Median body fat was 6.81% (interquartile range (IQR): 3.54-10.08%) and mean total body protein was 17.85 kg (± 1.9 SD). Body composition varied with lactational status but showed little difference between MCH-East and MCH-West (Figure 8). Lactating females had substantially lower body fat (mean 6.77 % ± 1.6 SD) but not protein (mean 17.63 kg ± 1.7 SD) than non-lactating females (mean 10.07 % ± 3.5 SD, 18.13 kg ± 1.6 SD), a pattern supported by a strong effect of lactation status in the two-way ANOVA (F = 40.9, P < 0.001). Subgroup membership and the subgroup × lactation interaction did not influence body fat. Body protein did not differ significantly by lactational status, subgroup, or their interaction. Although females in the MCH-East tended to have slightly higher body fat and protein than those in the MCH-West, these differences were not statistically supported (Figure 8).
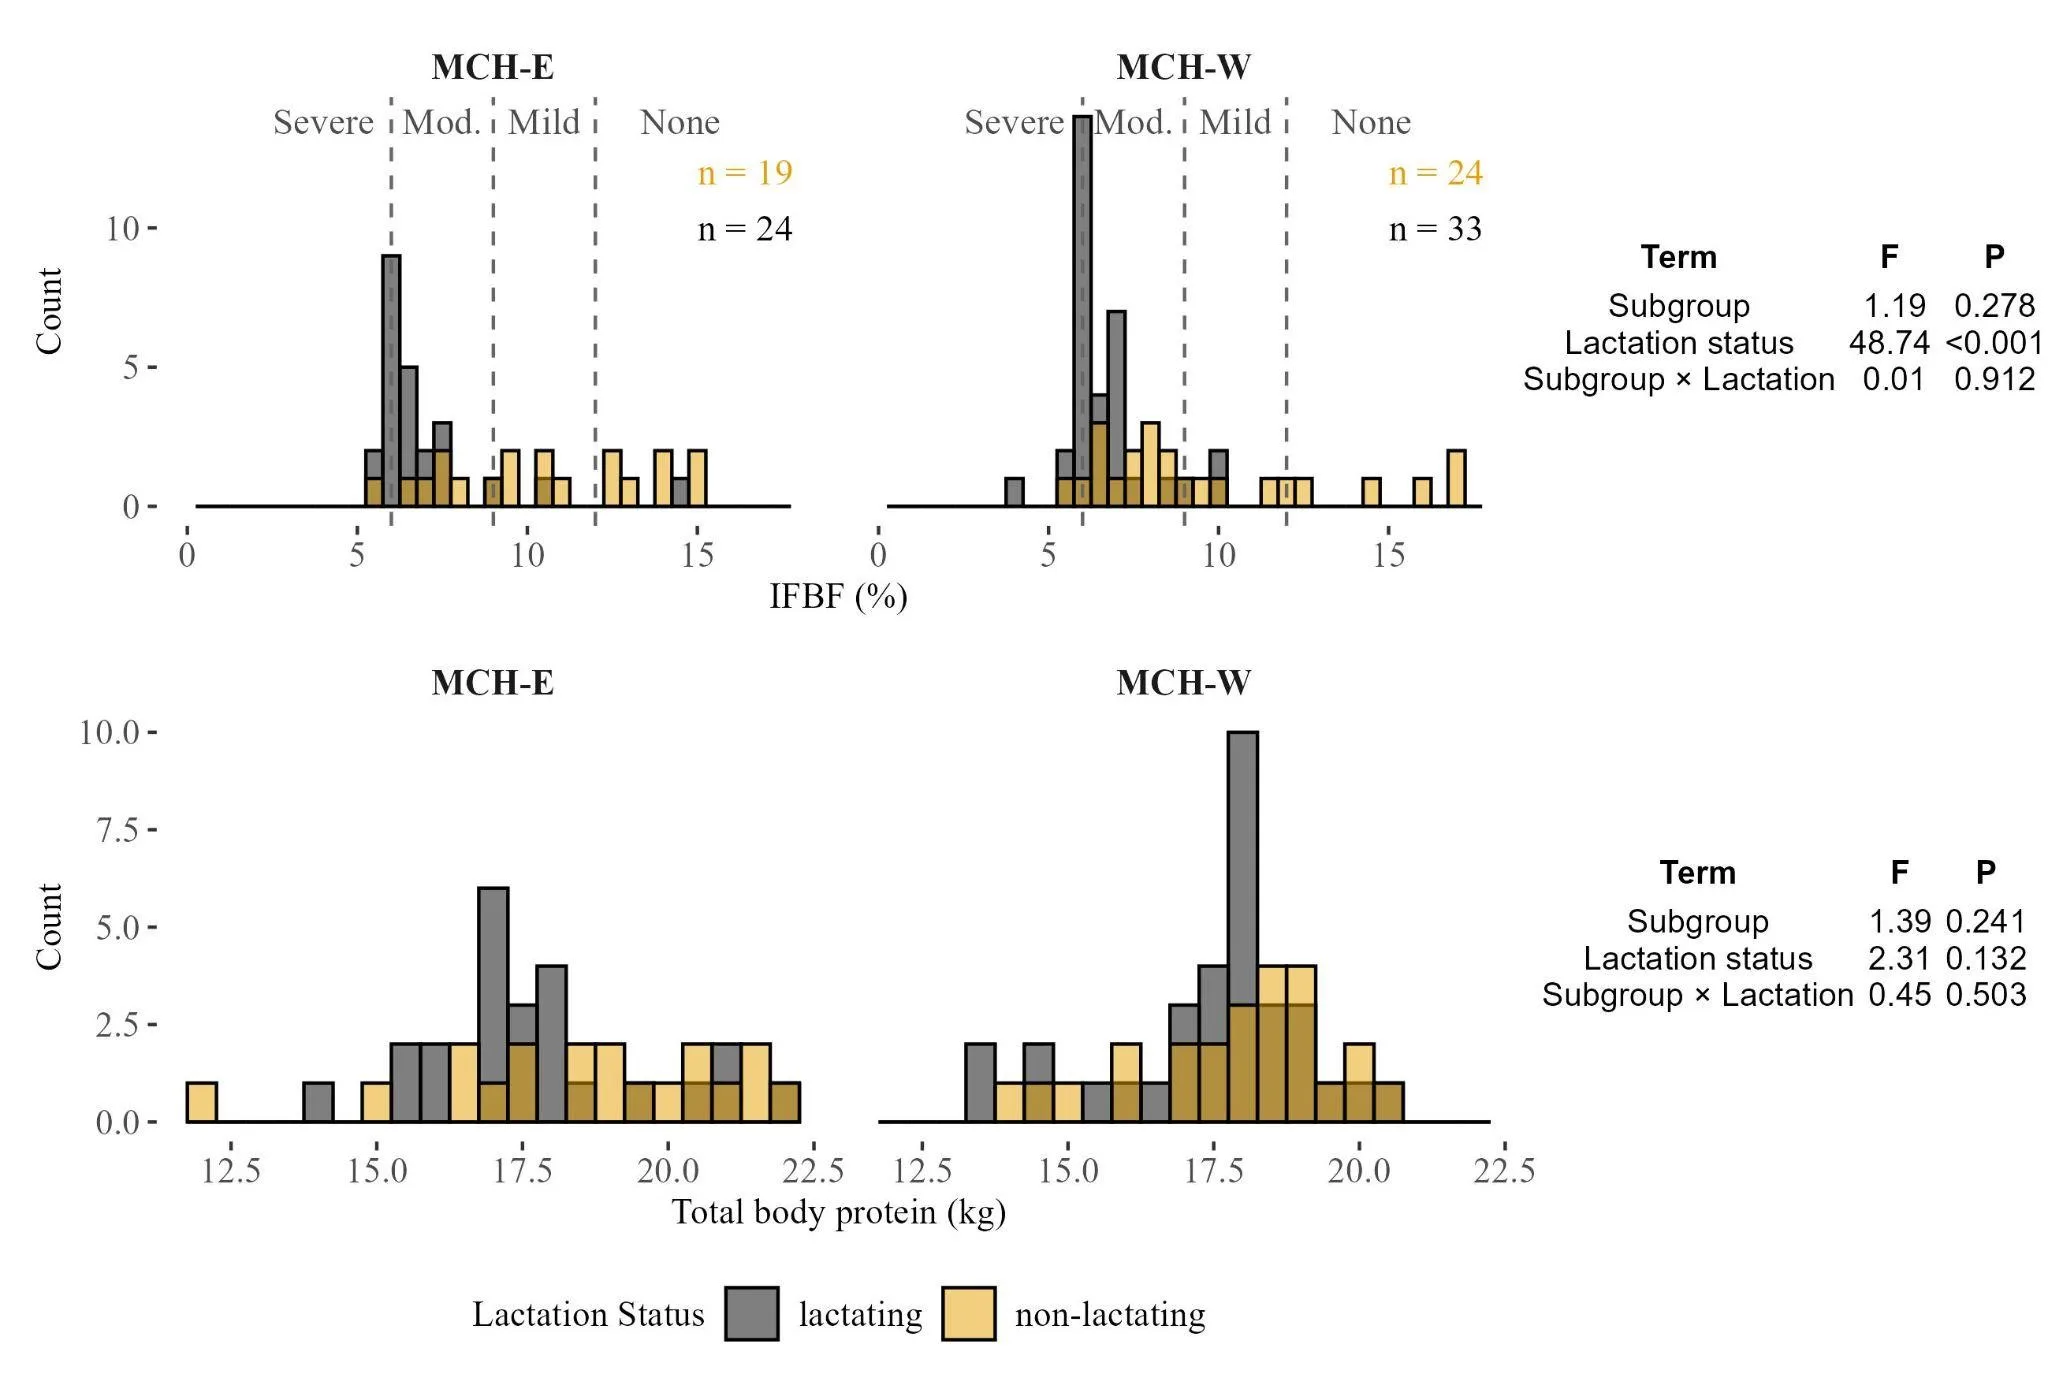
Figure 8. Frequency distributions of ingesta‑free body fat (IFBF, %) and total body protein (kg) of lactating and non‑lactating Mulchatna herd (MCH) female caribou across the two herd subgroups (MCH‑East and MCH‑West). Bars show frequency of each value bin (bins are 0.5 wide). ISBF thresholds are from Cook et al. (2021) for the Porcupine Herd. Embedded tables report two-way ANOVA results for each response variable. Sample sizes (n) are shown inset and colored by lactation status.
Discussion
Regional variation in caribou nutrition offers critical insights into the ecological and conservation dynamics of populations. Our findings revealed consistent and meaningful differences among discrete caribou groups in dietary patterns, levels of trace elements and heavy metals, and body condition between lactating and non-lactating females in the fall. Group differences in nutritional indices measured (e.g. δ15N) or estimated (e.g. diet) at multiple time points tended to persist, suggesting differences in the quantity and/or quality of forage available to different Southwest Alaska caribou groups or differences in forage selection. On the other hand, some indicators, such as fall body condition—assessed in the MCH—showed limited geographic differentiation despite differences in several nutritional markers, underscoring the complexity of linking nutritional markers to performance outcomes.
Dietary patterns and methodological considerations
Our SIMM-based diet and niche reconstructions, the first conducted for caribou in Southwest Alaska, revealed substantial dietary flexibility within and across groups (Figure 4). Overall, our diet estimates also differed somewhat from microhistology-based diet estimates for adjacent herds (Boertje, 1984, Joly and Cameron, 2018), particularly in the reduced contributions of lichens in the early fall and late winter-spring periods yet increased contributions during summer, and the increased prominence of shrubs and moss during the late winter period. Before concluding that landscape differences drove the observed dietary patterns, we acknowledge that methodological differences between these techniques could substantially contribute to the divergent estimates. SIMMs integrate longer-term dietary signals and are sensitive to metabolic routing and tissue-specific fractionation (Ben-David and Flaherty, 2012, Gannes et al., 1997). In contrast, microhistology provides direct identification of plant fragments but is limited to recently consumed forage and may be biased toward more identifiable and/or less digestible plant structures (Bergerud and Russell, 1964, see review in Garnick et al., 2018, Norbury, 1988).
Regardless of methodological caveats, the temporal and group diversity in diet is consistent with recent meta-analyses (Webber et al., 2022) and underscores the species’ remarkable adaptability as a generalist forager with dietary preferences. The greater shrub prominence relative to microhistology-based estimates in adjacent herds could reflect the enhanced availability of shrubs in this region (Macander et al., 2022, Mekonnen et al., 2021), the continued slow recovery of lichens from the MCH peak abundance in the late 1990s, or a relative lack of browsers in the system (Webber et al., 2022). However, estimated declines in macrolichen cover in the region between 1985 and 2020 were relatively modest compared to the substantial increases in shrub cover (Macander et al., 2022) and lichens remained prominent in our warm-season diet estimates.
The nutritional implications of the group and seasonal dietary variation we observed (Figure 4) depend on forage quality. Deciduous shrubs generally provide higher crude protein and digestible energy than mosses and lichens (Johnstone et al., 2002, Richert et al., 2021), though nutritional quality varies considerably among shrub species and plant parts (Thompson and Barboza, 2014). Graminoids offer intermediate quality that varies seasonally (Staaland et al., 1988), while forbs can be highly nutritious when available (Chapin et al., 1986). Lichens provide readily digestible carbohydrates but are relatively low in protein (Garmo, 1986). Groups consuming higher proportions of deciduous shrubs, forbs, and graminoids likely access superior forage quality, potentially affecting performance, though the fitness consequences remain unknown. The substantial lichen consumption we observed across groups during summer-fall (mean=32%, 95% CI: 12-58) may thus represent a tradeoff during this critical period—accessing reliable energy at the cost of protein intake—if higher quality forage is limited, patchily distributed, or difficult to access for other reasons.
Body condition
Fall body condition provides an integrated measure of summer-fall foraging success relative to energetic demands. Median body fat for MCH females in fall was 6.81% (IQR: 3.54-10.08%) overall, and 9.3% (IQR: 4.28-14.3%) for non-lactating females, values that fall within the range reported for other North American barren-ground herds during this season, including both expanding and contracting populations (Cook et al., 2021a, Cook et al., 2021b). The strong negative effect of lactation on body fat (Figure 8) was consistent across subgroups but expected given the energetic costs of lactation. While non-lactating females were dispersed across moderate, mild, and little-to-no nutritional limitation categories, the majority of lactating females from the Mulchatna herd had body fat levels indicative of animals experiencing moderate nutritional limitation—a category associated with reduced pregnancy rates, slow juvenile growth, and increased mortality in captive elk trials (Cook et al. 2004)— and consistent with a growing body of literature pointing to deficits in summer-autumn nutrition as a contemporary challenge of many ungulate populations (Cook et al. 2013, Monteith et al. 2014, Cook et al. 2017, Proffitt et al. 2016, Stephenson et al. 2020, Cook et al. 2021c). However, future efforts to interpret these body condition patterns and their probable effects on pregnancy, offspring growth, and survival in the MCH is complicated by the substantial seroprevalence (>30%) of Brucella suis, a pathogen capable of reducing reproductive performance through late-term abortion, stillbirth, infertility, and weak calves (Nielsen and Duncan 1990, Aguilar et al. 2022), that has been documented in the herd (Sattler 2021, Demma and Sattler 2022). We note that our non-lactating category likely included females that recently lost calves; if calf mortality occurred late in summer when lactating females typically show maximum depletion, this could reduce the apparent difference between lactation groups, though the strong statistical signal we observed suggests this effect was limited.
Although females in the MCH-East group tended to have slightly higher fat and protein reserves than those in the West, neither the two-way ANOVA nor the MCH-focused RDA detected significant effects of subgroup on body condition—only lactation status was significant (Figure 8, Table S3). In the MCH, the decoupling between isotopic/trace element markers and body condition could reflect several possibilities: (1) the dietary and trace element differences we detected may not be large enough to translate into meaningful body condition differences by October, (2) behavioral or physiological compensation may allow MCH-West females to maintain similar body reserves despite apparently poorer nutritional indicators, or (3) both subgroups experience similar overall nutritional constraints despite differing in specific markers. Unfortunately, we lacked body condition assessments for non-MCH caribou groups, which prevents us from determining whether the patterns we observed in the MCH are representative of Southwest Alaska populations generally.
Geographic patterns in isotope status
Our analyses of seasonal diets, trace minerals, heavy metals, and body condition indicate that geographic group—reflecting differences in spring, summer, and autumn range quality—is a strong predictor of δ15N and δ13C in Southwest Alaska caribou, while physiological state and specific trace elements introduce additional structure within groups. At the broad scale, caribou group explained significantly more isotopic variation (F = 14.7, P = 0.001) than any trace element, none of which were significant (Figure 7, Tables S2 and S3). Within the MCH, subgroup (East versus West) remained the strongest predictor of δ15N and δ13C (F=11.76, P=0.004), with East group females exhibiting higher values by 0.5-1‰ and 0.3‰, respectively, across tissues (Figure 2). While lactation also contributed significantly to isotopic variation within the MCH (F = 4.22, P = 0.019), its effect (estimated in the univariate ANOVA models) was smaller, averaging 0.52‰ and 0.13‰ in δ15N and δ13C, respectively (Figure S3). Several trace elements—Barium, Chromium, Magnesium, and Lead—were also significant predictors within the MCH (all P ≤ 0.046), each explaining variance comparable to or slightly below that of lactation.
The biological significance of the 3‰ difference in δ15N observed between caribou groups during summer-fall is challenging to interpret, but similar-magnitude differences in δ15N have been associated with variation in nutritional status and body condition in other caribou populations (Found et al., 2022). In the context of Southwest Alaska forage isotopic profiles (Figure S2), this level of δ15N variation is consistent with dietary shifts between forage types with different protein content (Brenning et al., 2024). Accordingly, the observed group isotopic differences—including the 0.5-1‰ MCH East-West difference—could reflect meaningful variation in forage quality and nutritional status. In the MCH-East we observed tendencies towards higher graminoid consumption than other groups during summer-fall (reflected in hair) and higher fungi consumption during late fall (reflected in serum, Figure 4), both of which corresponded with higher δ15N values (Figure 2). In contrast, the KL group consistently exhibited the lowest δ15N values, yet diet estimates did not reveal a clear dietary explanation, suggesting that other factors—such as physiological state or environmental conditions—may be influencing isotopic signatures in this group.
Trace elements, heavy metals, and potential performance consequences
Considerable variation in trace element and heavy metal concentrations across caribou groups—particularly elevated Cr and Cd in MCH-West as well as generally higher Pb in the KL and GB groups—raises questions about the environmental sources. Because hair trace element content reflects dietary intake and environmental exposure (Gamberg et al., 2020, Oster et al., 2018), these patterns may indicate underlying differences in geochemical landscapes or forage composition. Indeed, the observed spatial variation aligns with irregular concentrations of several trace elements (Pb, Zn, Ag, As, Cu, Mo) documented in the subsurface geology and soils of the region (Perryman et al., 2020, Riehle, 1994). However, most soil samples from the broader ranges of the MCH-West and KL groups did not return elevated Cr or Pb (Perryman et al., 2020), leaving the mechanism behind these elevated levels unresolved.
Assessing the biological relevance of these trace element differences remains challenging, as caribou-specific reference values linked to fitness outcomes are lacking. Moreover, the relationship between hair trace element levels and circulating concentrations or tissue stores—and ultimately, animal performance—is incompletely understood for free-ranging caribou, although Jutha et al. recently reported strong relationships for some elements (2022). Recent work by Rioux et al. (2022) found higher survival in caribou with elevated Zn and Na and lower Cs and Mn concentrations in hair samples, suggesting that such markers may reflect demographically relevant variation. Broader ungulate literature provides additional context: Cr deficiency is linked with impaired immune function, reduced growth rates, and reproductive problems, while excesses can cause organ damage (Puls, 1994, see Rioux et al., 2022 and references therein). In contrast, Pb and Cd, both non-essential and toxic, are associated with multiple adverse effects including reduced growth and immune function, reproductive impairment, and increased mortality (Beest et al., 2023, Puls, 1994). In the MCH-West the higher Cr, Cd, and Ba may create a challenging physiological scenario, as toxic levels of these trace elements can increase mortality, reduce pregnancy rates, impact calf growth rate, and compromise immune function (Puls 1988, Barboza and Parker 2006, Sparling 2016, Rioux et al. 2022). These effects are particularly relevant given the variability in age-specific pregnancy and survival rates observed over the last two decades among MCH subgroups and recent elevation in B. suis seroprevalence (Barten and Watine 2020, Sattler 2021, Demma and Sattler 2022), as compromised immunity could increase disease susceptibility. However, neither the ANOVA or RDA analyses detected relationships between subgroup, trace element levels, and body condition (Table S3), suggesting that in this herd any influence these trace elements exert on body condition may—at the observed levels of exposure—be buffered by other aspects of nutrition or behavioral compensation.
Management implications and knowledge gaps
The persistent variation we documented in diet composition, tissue chemistry, trace element, and heavy metal status among caribou herds in Southwest Alaska has potential implications for population dynamics and conservation. If these nutritional differences translate to fitness—a connection we could not establish with our data—we might expect variation in vital rates (pregnancy rates, calf survival, adult survival) that could drive asynchronous population trends even within a single herd. However, nutritional deficits seldom present as obvious or catastrophic events. More frequently they accumulate over years, and act subtly, altering individuals susceptibility to disease, predation, and resilience to stochastic weather events (Bender et al. 2008, Bastille-Rousseau et al. 2016, Johnson et al. 2019), without manifesting in commonly monitored herd performance metrics like pregnancy and adult survival (Cook et al. 2004, Simard et al., 2008, Monteith et al., 2014), underscoring the value of integrating isotopic and trace element markers into long-term monitoring frameworks.
For management, these findings suggest that large caribou herds managed as homogeneous units may contain important internal ecological structure (Paez et al. 2026). Areas supporting better nutritional indicators may warrant conservation attention as potential source habitats, while identifying specific factors limiting nutrition in other areas and could guide targeted habitat management or other interventions. However, we emphasize a critical limitation: without corresponding individual fitness data—pregnancy rates, calf recruitment, adult survival—we cannot conclusively link the nutritional patterns we observed to population-level consequences, as the differences we documented may or may not exceed thresholds necessary to affect individual performance and population dynamics over the longer-term.
This limitation extends to our interpretation of dietary flexibility and climate resilience. Our data, collected from five caribou groups across a region exceeding 400,000 km2 in size, demonstrate the capacity of caribou to adapt their dietary patterns and acquire essential nutrients in the face of extreme spatiotemporal diversity in resource availability. Whether this dietary flexibility confers resilience during rapid climate-driven vegetation changes—particularly the widespread expansion of shrubs and decline of lichens documented across caribou ranges and Southwest Alaska—remains a critical unanswered question. The prominence of deciduous shrubs in most groups’ diets indicates a capacity to exploit shrub-dominated landscapes, but whether further shrub expansion leads to adequate nutrition, especially during energetically demanding periods like late winter gestation and neonatal period—when lichens have been traditionally thought to be critical—is unknown.
Addressing these questions requires moving beyond the baseline description our study provides to integrated monitoring that simultaneously tracks diet composition, body condition, trace element status, and demographic vital rates across multiple years, varying herd densities, and changing environments. Only through such comprehensive, long-term monitoring can we determine whether the nutritional patterns we observed represent adaptive foraging in productive habitats or constrained choices within degrading landscapes. For the Mulchatna herd—which remains at historically low abundance despite hunting closures and predator control efforts—and for other northern caribou populations facing similar challenges, establishing these linkages between nutrition and population performance is essential for evidence-based conservation in a rapidly changing North.
Acknowledgments
We thank John Crouse (ADFG) for training and mentorship in estimating caribou body condition and assistance in field work, and Jeff Stetz (ADFG) for consistent project support, and Timm Nawrocki and Amanda Droghini of the Alaska Center for Conservation Science for their invaluable assistance with the vegetation collection protocols and field work. Special thanks to Davin Louangaphay and Angelika Kassel for their hard work in tissue sample processing and analysis. We appreciate the constructive feedback from Kristin Denryter (ADFG) and five anonymous reviewers, which improved the quality of this manuscript. We are grateful to the University of Alaska Anchorage for providing access to resources and facilities essential to this study.
Author Contributions
Robert G. Jespersen: Conceptualization, Data curation, Formal analysis, Investigation, Methodology, Writing – original draft, Writing –review and editing
Renae Sattler: Conceptualization, Funding acquisition, Project administration, Resources, Data collection and curation, Formal analysis, Investigation, Methodology, Writing – original draft, Writing – review and editing
Dominic Demma: Conceptualization, Funding acquisition, Data collection, Methodology, Writing – review and editing
Jeffrey M. Welker: Conceptualization, Resources, Project administration, Methodology, Writing – review and editing
Data Availability
All data and code can be found here.
Supplementary Information
Supplementary information can be found here.
Transparent Peer Review
Results from the Transparent Peer Review can be found here.
Recommended Citation
Jespersen, R. G., R. Sattler, D. Demma, and J. M. Welker. 2026. Seasonal diets, trace minerals, heavy metals, and body condition: nutritional characteristics of barren ground caribou in Southwest Alaska. Stacks Journal: 26002. https://doi.org/10.60102/stacks-26007
References
Adamczewski, J. Z., C. C. Gates, R. J. Hudson, and M. A. Price. 1987. Seasonal changes in body composition of mature female caribou and calves (Rangifer tarandus groenlandicus) on an arctic island with limited winter resources. Canadian Journal of Zoology 65: 1149–57. https://doi.org/10.1139/z87-180.
Aguilar, X. F., I. H. Nymo, K. Beckmen, S. Dresvyanikova, I. Egorova, and S. Kutz. 2022. Brucellosis in the Arctic and Northern Regions. In Arctic One Health, edited by M. Tryland. Cham: Springer.https://doi.org/10.1007/978-3-030-87853-5_10.
Alaska Department of Fish and Game, Division of Wildlife Conservation. 2016. Annual report to the Alaska Board of Game on intensive management for caribou with wolf predation control in Game Management Units 9B, 17B and 17C, and 19A and 19B: The Mulchatna caribou herd. Juneau.
Alaska Department of Fish and Game, Division of Wildlife Conservation. 2023. Operational plan for intensive management of caribou (Rangifer tarandus) in Game Management Units 8B, 17, 18, 19A and 19B during regulatory years 2022–2028. V. 2.1. https://www.adfg.alaska.gov/static/applications/web/nocache/regulations/regprocess/gameboard/pdfs/2022-2023/sc/rc4_1.4.pdf.
Albon, S. D., A. Stien, R. J. Irvine, R. Langvatn, E. Ropstad, and O. Halvorsen. 2002. The role of parasites in the dynamics of a reindeer population. Proceedings of the Royal Society B: Biological Sciences 269: 1625–32.https://doi.org/10.1098/rspb.2002.2064.
Bali, A., and G. P. Kofinas. 2014. Voices of the Caribou People: A participatory videography method to document and share local knowledge from the North American human-Rangifer systems. Ecology and Society 19.https://doi.org/10.5751/ES-06327-190216.
Barten, N. L., and L. N. Watine. 2020. Caribou management report and plan, Game Management Units 9B, 9C, 17, 18, 19A, 19B: Report period 1 July 2012–30 June 2017, and plan period 1 July 2017–30 June 2022. Juneau: Alaska Department of Fish and Game.
Bastille-Rousseau, G., J. A. Schaefer, K. P. Lewis, M. A. Mumma, E. H. Ellington, N. D. Rayl, S. P. Mahoney, D. Pouliot, and D. L. Murray. 2016. Phase-dependent climate–predator interactions explain three decades of variation in neonatal caribou survival. Journal of Animal Ecology 85: 445–56. https://doi.org/10.1111/1365-2656.12466.
Beest, F. M. van, N. M. Schmidt, L. Stewart, L. H. Hansen, A. Michelsen, J. B. Mosbacher, H. Gilbert, G. Le Roux, and S. V. Hansson. 2023. Geochemical landscapes as drivers of wildlife reproductive success: Insights from a high-Arctic ecosystem. Science of the Total Environment 903: 166567. https://doi.org/10.1016/j.scitotenv.2023.166567.
Bender, L. C., J. G. Cook, R. C. Cook, and P. B. Hall. 2008. Relations between nutritional condition and survival of North American elk (Cervus elaphus). Wildlife Biology 14: 70–80. https://doi.org/10.2981/0909-6396(2008)14[70:RBNCAS]2.0.CO;2.
Ben-David, M., and E. A. Flaherty. 2012. Stable isotopes in mammalian research: A beginner’s guide. Journal of Mammalogy 93: 312–28. https://doi.org/10.1644/11-MAMM-S-166.1.
Bergerud, A. T. 1996. Evolving perspectives on caribou population dynamics, have we got it right yet? Rangifer 16: 95–116.https://doi.org/10.7557/2.16.4.1225.
Bergerud, A. T., and L. Russell. 1964. Evaluation of rumen food analysis for Newfoundland caribou. Journal of Wildlife Management 28: 809–14. https://doi.org/10.2307/3798798.
Boertje, R. D. 1984. Seasonal diets of the Denali caribou herd, Alaska. Arctic 37: 161–65. https://doi.org/10.14430/arctic2182.
Borish, D., A. Cunsolo, J. Snook, I. Shiwak, M. Wood, I. Mauro, C. Dewey, and S. L. Harper. 2021. Caribou was the reason, and everything else happened after: Effects of caribou declines on Inuit in Labrador, Canada. Global Environmental Change 68: 102268. https://doi.org/10.1016/j.gloenvcha.2021.102268.
Box, J. E., W. T. Colgan, T. R. Christensen, N. M. Schmidt, M. Lund, F. J. W. Parmentier, R. Brown, U. S. Bhatt, E. S. Euskirchen, V. E. Romanovsky, J. E. Walsh, J. E. Overland, M. Wang, R. W. Corell, W. N. Meier, B. Wouters, S. Mernild, J. Mård, J. Pawlak, and M. S. Olsen. 2019. Key indicators of Arctic climate change: 1971–2017. Environmental Research Letters 14. https://doi.org/10.1088/1748-9326/aafc1b.
Buchwal, A., P. F. Sullivan, M. Macias-Fauria, E. Post, I. Myers-Smith, J. C. Stroeve, D. Blok, K. D. Tape, B. C. Forbes, P. Ropars, E. Lévesque, B. Elberling, S. Angers-Blondin, J. S. Boyle, S. Boudreau, N. Boulanger-Lapointe, C. Gamm, M. Hallinger, G. Rachlewicz, A. Young, P. Zetterberg, and J. M. Welker. 2020. Divergence of Arctic shrub growth associated with sea ice decline. Proceedings of the National Academy of Sciences 117:33334-33344. https://doi.org/10.1073/pnas.2013311117.
Brenning, M., F. J. Longstaffe, and D. Fraser. 2024. Variation in stable carbon (δ13C) and nitrogen (δ15N) isotope compositions along antlers of Qamanirjuaq caribou (Rangifer tarandus groenlandicus). Ecology and Evolution 14: e11006. https://doi.org/10.1002/ece3.11006.
Cameron, R. D., W. T. Smith, S. G. Fancy, K. L. Gerhart, and R. G. White. 1993. Calving success of female caribou in relation to body weight. Canadian Journal of Zoology 71: 480–86. https://doi.org/10.1139/Z93-069.
Chan-McLeod, A. C. A., R. G. White, and D. F. Holleman. 1994. Effects of protein and energy intake, body condition, and season on nutrient partitioning and milk production in caribou and reindeer. Canadian Journal of Zoology 72: 938–47. https://doi.org/10.1139/z94-127.
Chapin, F. S., J. D. McKendrick, and D. A. Johnson. 1986. Seasonal changes in carbon fractions in Alaskan tundra plants of differing growth form: Implications for herbivory. Journal of Ecology 74: 707–31. https://doi.org/10.2307/2260393.
Colson, K. E., K. H. Mager, and K. J. Hundertmark. 2014. Reindeer introgression and the population genetics of caribou in southwestern Alaska. Journal of Heredity 105: 585–96. https://doi.org/10.1093/jhered/esu030.
Cook, J. G., B. K. Johnson, R. C. Cook, R. A. Riggs, R. DelCurto, L. D. Bryant, and L. L. Irwin. 2004. Effects of summer–autumn nutrition and parturition date on reproduction and survival of elk. Wildlife Monographs 155: 1–61. https://doi.org/10.2193/0084-0173(2004)155[1:EOSNAP]2.0.CO;2.
Cook, R. C., J. G. Cook, D. J. Vales, B. K. Johnson, S. M. McCorquodale, L. A. Shipley, R. A. Riggs, L. L. Irwin, S. L. Murphie, B. L. Murphie, K. A. Schoenecker, F. Geyer, P. B. Hall, R. D. Spencer, D. A. Immell, D. H. Jackson, B. L. Tiller, P. J. Miller, and L. Schmitz. 2013. Regional and seasonal patterns of nutritional condition and reproduction in elk. Wildlife Monographs 184: 1–45. https://doi.org/10.1002/wmon.1008.
Cook, J. G., R. C. Cook, R. W. Davis, and L. L. Irwin. 2016. Nutritional ecology of elk during summer and autumn in the Pacific Northwest. Wildlife Monographs 195: 1–81. https://doi.org/10.1002/wmon.1020.
Cook, J. G., A. P. Kelly, R. C. Cook, B. Culling, D. Culling, A. McLaren, N. C. Larter, and M. Watters. 2021a. Seasonal patterns in nutritional condition of caribou (Rangifer tarandus) in the southern Northwest Territories and northeastern British Columbia, Canada. Canadian Journal of Zoology 99: 845–58.https://doi.org/10.1139/cjz-2021-0057.
Cook, R. C., J. A. Crouse, J. G. Cook, and T. R. Stephenson. 2021b. Evaluating indices of nutritional condition for caribou (Rangifer tarandus): Which are the most valuable and why? Canadian Journal of Zoology 99: 596–613. https://doi.org/10.1139/cjz-2020-0149.
Cook, R. C., J. Oyster, K. Mansfield, and R. B. Harris. 2021c. Evidence of summer nutritional limitations in a northeastern Washington moose population. Alces 57: 23–46.
Couturier, S., S. D. Côté, J. Huot, and R. D. Otto. 2009. Body-condition dynamics in a northern ungulate gaining fat in winter. Canadian Journal of Zoology 87: 367–78. https://doi.org/10.1139/Z09-020.
Craine, J. M., A. J. Elmore, M. P. M. Aidar, M. Bustamante, T. E. Dawson, E. A. Hobbie, A. Kahmen, M. C. Mack, K. K. McLauchlan, A. Michelsen, G. B. Nardoto, L. H. Pardo, J. Peñuelas, P. B. Reich, E. A. G. Schuur, W. D. Stock, P. H. Templer, R. A. Virginia, J. M. Welker, and I. J. Wright. 2009. Global patterns of foliar nitrogen isotopes and their relationships with climate, mycorrhizal fungi, foliar nutrient concentrations, and nitrogen availability. New Phytologist 183: 980–92. https://doi.org/10.1111/j.1469-8137.2009.02917.x.
Crête, M., and J. Huot. 1993. Regulation of a large herd of migratory caribou: Summer nutrition affects calf growth and body reserves of dams. Canadian Journal of Zoology 71: 2291–96. https://doi.org/10.1139/z93-321.
Cuyler, C., and N. A. Øritsland. 2002. Do seasonal changes in Svalbard reindeer fur have relevance for heat transfer? Rangifer 22: 133–42. https://doi.org/10.7557/2.22.2.1532.
Demma, N. 2019. Mulchatna caribou calf survival and mortality. Juneau: Alaska Department of Fish and Game.
Demma, D. J., and R. L. Sattler. 2022. Mulchatna caribou herd overview. Paper presented at Central and Southwest Region Board of Game Meeting, Wasilla, Alaska, January 21.
Denryter, K. A., R. C. Cook, J. G. Cook, and K. L. Parker. 2017. Straight from the caribou’s mouth: Detailed observations of tame caribou reveal new insights into summer–autumn diets. Canadian Journal of Zoology 95: 81–94. https://doi.org/10.1139/cjz-2016-0114.
Denryter, K., R. C. Cook, J. G. Cook, K. L. Parker, and M. P. Gillingham. 2020. State-dependent foraging by caribou with different nutritional requirements. Journal of Mammalogy 101: 544–57. https://doi.org/10.1093/jmammal/gyaa003.
Drucker, D. G., K. A. Hobson, J. P. Ouellet, and R. Courtois. 2010. Influence of forage preferences and habitat use on 13C and 15N abundance in wild caribou (Rangifer tarandus caribou) and moose (Alces alces) from Canada. Isotopes in Environmental and Health Studies 46: 107–21. https://doi.org/10.1080/10256010903388410.
Fall, J. A. 2016. Regional patterns of fish and wildlife harvests in contemporary Alaska. Arctic 69: 47–64. https://doi.org/10.14430/arctic4547.
Ferguson, M. A., L. Gauthier, and F. Messier. 2001. Range shift and winter foraging ecology of a population of Arctic tundra caribou. Canadian Journal of Zoology 79: 746–58. https://doi.org/10.1139/z01-013.
Flueck, W. T. 1994. Effect of trace elements on population dynamics: Selenium deficiency in free-ranging black-tailed deer. Ecology 75: 807–12. https://doi.org/10.2307/1941736.
Found, R., J. A. Baker, J. M. Fryxell, A. A. D. McLaren, A. R. Rodgers, J. Shuter, I. Thompson, and B. R. Patterson. 2022. Stable isotopes indicate reduced body condition of caribou in disturbed areas. Animal Biology 72: 415–33. https://doi.org/10.1163/15707563-BJA10092.
Gamberg, M., I. Pratte, J. Brammer, C. Cuyler, B. Elkin, K. Gurney, S. Kutz, N. C. Larter, D. Muir, X. Wang, and J. F. Provencher. 2020. Renal trace elements in barren-ground caribou subpopulations: Temporal trends and differing effects of sex, age and season. Science of the Total Environment 724: 138305. https://doi.org/10.1016/j.scitotenv.2020.138305.
Gannes, L. Z., D. M. O’Brien, and C. M. del Rio. 1997. Stable isotopes in animal ecology: Assumptions, caveats, and a call for more laboratory experiments. Ecology 78: 1271–76. https://doi.org/10.1890/0012-9658(1997)078[1271:SIIAEA]2.0.CO;2.
Garmo, T. H. 1986. Chemical composition and in vitro dry matter digestibility of lichens. Rangifer 6: 8–13. https://doi.org/10.7557/2.6.1.569.
Garnick, S., P. S. Barboza, and J. W. Walker. 2018. Assessment of animal-based methods used for estimating and monitoring rangeland herbivore diet composition. Rangeland Ecology & Management 71: 449–57. https://doi.org/10.1016/j.rama.2018.03.003.
Grabinski, Z., and H. R. McFarland. 2025. Alaska’s changing wildfire environment 2.0. Fairbanks: Alaska Fire Science Consortium, International Arctic Research Center, University of Alaska Fairbanks.
Gunn, A., and F. L. Miller. 1986. Traditional behaviour and fidelity to caribou calving grounds by barren-ground caribou. Rangifer: 151–58. https://doi.org/10.7557/2.6.2.640.
Gunn, A., and W. Nixon. 2008. Rangifer health and body condition monitoring: Monitoring protocols. Akureyri: CircumArctic Rangifer Monitoring and Assessment Network.
Gustine, D. D., P. S. Barboza, L. G. Adams, R. G. Farnell, and K. L. Parker. 2011. An isotopic approach to measuring nitrogen balance in caribou. Journal of Wildlife Management 75: 178–88. https://doi.org/10.1002/jwmg.11.
Gustine, D. D., P. S. Barboza, J. P. Lawler, L. G. Adams, K. L. Parker, S. M. Arthur, and B. S. Shults. 2012. Diversity of nitrogen isotopes and protein status in caribou: Implications for monitoring northern ungulates. Journal of Mammalogy 93: 778–90. https://doi.org/10.1644/11-MAMM-A-164.1.
Halley, D. J., M. Minagawa, M. Nieminen, and E. Gaare. 2010. Diet: Tissue stable isotope fractionation of carbon and nitrogen in blood plasma and whole blood of male reindeer (Rangifer tarandus). Polar Biology 33: 1303–9. https://doi.org/10.1007/s00300-010-0817-9.
Hansen, B. B., M. Gamelon, S. D. Albon, A. M. Lee, A. Stien, R. J. Irvine, B. E. Sæther, L. E. Loe, E. Ropstad, V. Veiberg, and V. Grøtan. 2019. More frequent extreme climate events stabilize reindeer population dynamics. Nature Communications, 10: 1616. https://doi.org/10.1038/s41467-019-09332-5.
Hilderbrand, G. V., S. D. Farley, C. T. Robbins, T. A. Hanley, K. Titus, and C. Servheen. 1996. Use of stable isotopes to determine diets of living and extinct bears. Canadian Journal of Zoology 74: 2080–88. https://doi.org/10.1139/Z96-236.
Hiltunen, T. A., A. Stien, M. Väisänen, E. Ropstad, J. O. Aspi, and J. M. Welker. 2022. Svalbard reindeer winter diets: Long-term dietary shifts to graminoids in response to a changing climate. Global Change Biology 28: 7009–22. https://doi.org/10.1111/gcb.16420.
Jackson, A. L., R. Inger, A. C. Parnell, and S. Bearhop. 2011. Comparing isotopic niche widths among and within communities: SIBER—stable isotope Bayesian ellipses in R. Journal of Animal Ecology 80: 595–602. https://doi.org/10.1111/j.1365-2656.2011.01806.x.
Jespersen, R. G. G., A. J. Leffler, S. F. Oberbauer, and J. M. Welker. 2018. Arctic plant ecophysiology and water source utilization in response to altered snow: Isotopic (δ18O and δ2H) evidence for meltwater subsidies to deciduous shrubs. Oecologia 187: 1009–23. https://doi.org/10.1007/s00442-018-4196-1.
Johnson, B. K., D. H. Jackson, R. C. Cook, D. A. Clark, P. K. Coe, J. G. Cook, S. N. Rearden, S. L. Findholt, and J. H. Noyes. 2019. Roles of maternal condition and predation in survival of juvenile elk in Oregon. Wildlife Monographs 201: 1–60. https://doi.org/10.1002/wmon.1039.
Johnson, H. E., T. S. Golden, L. G. Adams, D. D. Gustine, E. A. Lenart, and P. S. Barboza. 2021. Dynamic selection for forage quality and quantity in response to phenology and insects in an Arctic ungulate. Ecology and Evolution 11: 11664–88. https://doi.org/10.1002/ece3.7852.
Johnson, H. E., E. A. Lenart, D. D. Gustine, L. G. Adams, and P. S. Barboza. 2022. Survival and reproduction in Arctic caribou are associated with summer forage and insect harassment. Frontiers in Ecology and Evolution 10: 899585. https://doi.org/10.3389/fevo.2022.899585.
Johnstone, J., D. E. Russell, and B. Griffith. 2002. Variations in plant forage quality in the range of the Porcupine caribou herd. Rangifer 22. https://doi.org/10.7557/2.22.1.693.
Joly, K., and M. D. Cameron. 2018. Early fall and late winter diets of migratory caribou in northwest Alaska. Rangifer 38: 27–38. https://doi.org/10.7557/2.38.1.4107.
Joly, K., M. J. Cole, and R. R. Jandt. 2007. Diets of overwintering caribou (Rangifer tarandus) track decadal changes in Arctic tundra vegetation. Canadian Field-Naturalist 121: 379–83. https://doi.org/10.22621/cfn.v121i4.5094.
Joly, K., D. R. Klein, D. L. Verbyla, T. S. Rupp, and F. S. Chapin. 2011. Linkages between large-scale climate patterns and the dynamics of Arctic caribou populations. Ecography 34: 345–52. https://doi.org/10.1111/j.1600-0587.2010.06377.x.
Joly, K., S. K. Wasser, and R. Booth. 2015. Non-invasive assessment of the interrelationships of diet, pregnancy rate, group composition, and physiological and nutritional stress of barren-ground caribou in late winter. PLOS ONE 10: e0127586. https://doi.org/10.1371/journal.pone.0127586.
Julian, P., and D. Helsel. 2021. NADA2: Data analysis for censored environmental data. https://doi.org/10.32614/CRAN.package.NADA2.
Jutha, N., C. Jardine, H. Schwantje, J. Mosbacher, D. Kinniburgh, and S. Kutz. 2022. Evaluating the use of hair as a non-invasive indicator of trace mineral status in woodland caribou (Rangifer tarandus caribou). PLOS ONE 17: e0269441. https://doi.org/10.1371/journal.pone.0269441.
Kuropat, P. J. 1984. Foraging behavior of caribou on a calving ground in northwestern Alaska. Master’s thesis. University of Alaska Fairbanks. Fairbanks, Alaska.
Lecomte, N., Ø. Ahlstrøm, D. Ehrich, E. Fuglei, R. A. Ims, and N. G. Yoccoz. 2011. Intrapopulation variability shaping isotope discrimination and turnover: Experimental evidence in Arctic foxes. PLOS ONE 6: e21357. https://doi.org/10.1371/journal.pone.0021357.
Lenth, R. V. 2021. emmeans: Estimated marginal means, aka least-squares means.https://doi.org/10.32614/CRAN.package.emmeans.
Lichwa, E., and J. Landsiedel. 2024. 2024 Mulchatna herd photo survey. Alaska Department of Fish and Game.
Macander, M. J., and P. R. Nelson. 2022. ABoVE: Modeled top cover by plant functional type over Alaska and Yukon, 1985–2020. ORNL Distributed Active Archive Center. https://doi.org/10.3334/ORNLDAAC/2032.
Macander, M. J., P. R. Nelson, T. W. Nawrocki, G. V. Frost, K. M. Orndahl, E. C. Palm, A. F. Wells, and S. J. Goetz. 2022. Time-series maps reveal widespread change in plant functional type cover across Arctic and boreal Alaska and Yukon. Environmental Research Letters 17: 054042. https://doi.org/10.1088/1748-9326/ac6965.
Mallory, C. D., M. W. Campbell, and M. S. Boyce. 2018. Climate influences body condition and synchrony of barren-ground caribou abundance in northern Canada. Polar Biology 41: 855–64. https://doi.org/10.1007/s00300-017-2248-3.
Mekonnen, Z. A., and R. F. Grant. 2018. Modelling impacts of recent warming on seasonal carbon exchange in higher latitudes of North America. Arctic Science 4: 471–84. https://doi.org/10.1139/as-2016-0009.
Mekonnen, Z. A., W. J. Riley, L. T. Berner, N. J. Bouskill, M. S. Torn, G. Iwahana, A. L. Breen, I. H. Myers-Smith, M. G. Criado, Y. Liu, E. S. Euskirchen, S. J. Goetz, M. C. Mack, and R. F. Grant. 2021. Arctic tundra shrubification: A review of mechanisms and impacts on ecosystem carbon balance. Environmental Research Letters 16: 053001. https://doi.org/10.1088/1748-9326/abf28b.
Messier, F., J. Huot, D. L. Hénault, and S. Luttich. 1988. Demography of the George River caribou herd: Evidence of population regulation by forage exploitation and range expansion. Arctic: 279–87. https://doi.org/10.14430/arctic1733.
Miller, F. L. 1972. Eruption and attrition of mandibular teeth in barren-ground caribou. Journal of Wildlife Management 36: 606–12. https://doi.org/10.2307/3799093.
Miranda Paez, A., R. Sattler, G. Amorim de Albuquerque Silva, G. Lamka, D. Demma, and J. R. Willoughby. 2026. Persistent genetic connectivity in caribou may buffer against inbreeding effects. PeerJ 14: e20912. https://doi.org/10.7717/peerj.20912.
Mitchell, G., P. J. Wilson, M. Manseau, B. Redquest, B. R. Patterson, and L. Y. Rutledge. 2022. DNA metabarcoding of faecal pellets reveals high consumption of yew (Taxus spp.) by caribou (Rangifer tarandus) in a lichen-poor environment. FACETS 7: 701–17. https://doi.org/10.1139/facets-2021-0071.
Monteith, K. L., V. C. Bleich, T. R. Stephenson, B. M. Pierce, M. M. Conner, J. G. Kie, and R. T. Bowyer. 2014. Life-history characteristics of mule deer: Effects of nutrition in a variable environment. Wildlife Monographs 186: 1–62. https://doi.org/10.1002/wmon.1011.
Monteith, K. L., T. R. Stephenson, V. C. Bleich, M. M. Conner, B. M. Pierce, and R. T. Bowyer. 2013. Risk-sensitive allocation in seasonal dynamics of fat and protein reserves in a long-lived mammal. Journal of Animal Ecology 82: 377–88. https://doi.org/10.1111/1365-2656.12016.
Murie, O. J. 1935. Alaska-Yukon caribou. North American Fauna 54. https://doi.org/10.3996/NAFA.54.0001.
Nagati, M., M.-J. Bergeron, P. Gagné, A. Arsenault, A. Droit, P. Wilson, G. Pittoello, S. Kutz, M. Manseau, and C. Martineau. 2024. Exploring winter diet, gut microbiota and parasitism in caribou using multi-marker metabarcoding of fecal DNA. Scientific Reports 14: 27960.https://doi.org/10.1038/s41598-024-76594-5.
Nawrocki, T. W. 2021. Continuous foliar cover of vegetation for North American Beringia (version 1.0). Zenodo.https://doi.org/10.5281/zenodo.3897482.
Nielsen, K., and R. J. Duncan. 1990. Animal brucellosis. Boca Raton, FL: CRC Press.
Newsome, S. D., M. T. Tinker, D. H. Monson, O. T. Oftedal, K. Ralls, M. M. Staedler, M. L. Fogel, and J. A. Estes. 2009. Using stable isotopes to investigate individual diet specialization in California sea otters (Enhydra lutris nereis). Ecology 90: 961–74. https://doi.org/10.1890/07-1812.1.
Norbury, G. 1988. Microscopic analysis of herbivore diets—A problem and a solution. Wildlife Research 15: 51–57. https://doi.org/10.1071/WR9880051.
O’Hara, T. M., G. Carroll, P. Barboza, K. Mueller, J. Blake, V. Woshner, and C. Willetto. 2001. Mineral and heavy metal status as related to a mortality event and poor recruitment in a moose population in Alaska. Journal of Wildlife Diseases 37: 509–22. https://doi.org/10.7589/0090-3558-37.3.509.
Oksanen, J., G. L. Simpson, F. G. Blanchet, R. Kindt, P. Legendre, P. R. Minchin, R. B. O’Hara, P. Solymos, M. H. H. Stevens, E. Szoecs, H. Wagner, M. Barbour, M. Bedward, B. Bolker, D. Borcard, G. Carvalho, M. Chirico, M. De Cáceres, S. Durand, H. H. Wagner, and J. Weedon. 2022. vegan: Community ecology package. https://cran.r-project.org/package=vegan.
Oster, K. W., P. S. Barboza, D. D. Gustine, K. Joly, and R. D. Shively. 2018. Mineral constraints on Arctic caribou (Rangifer tarandus): A spatial and phenological perspective. Ecosphere 9: e02160. https://doi.org/10.1002/ecs2.2160.
Pan, C. G., P. B. Kirchner, J. S. Kimball, Y. Kim, and J. Du. 2018. Rain-on-snow events in Alaska: Their frequency and distribution from satellite observations. Environmental Research Letters 13: 075004. https://doi.org/10.1088/1748-9326/aac9d3.
Parker, K. L., M. P. Gillingham, T. A. Hanley, and C. T. Robbins. 1999. Energy and protein balance of free-ranging black-tailed deer in a natural forest environment. Wildlife Monographs 143: 3–48.
Perry, P. L. 2023. Moose management report and plan, Game Management Unit 18. Alaska Department of Fish and Game.
Perryman, C. R., J. Wirsing, K. A. Bennett, O. Brennick, A. L. Perry, N. Williamson, and J. G. Ernakovich. 2020. Heavy metals in the Arctic: Distribution and enrichment of five metals in Alaskan soils. PLOS ONE 15: e0233297. https://doi.org/10.1371/journal.pone.0233297.
Proffitt, K. M., M. Hebblewhite, W. Peters, N. Hupp, and J. Shamhart. 2016. Linking landscape-scale differences in forage to ungulate nutritional ecology. Ecological Applications 26: 2156–74. https://doi.org/10.1002/eap.1370.
Puls, R. 1994. Mineral levels in animal health: Diagnostic data. Sherpa International.
R Core Team. 2025. R: A language and environment for statistical computing. Vienna: R Foundation for Statistical Computing.
Richert, J. C., A. J. Leffler, D. E. Spalinger, and J. M. Welker. 2021. Snowier winters extend autumn availability of high-quality forage for caribou in Arctic Alaska. Ecosphere 12: e03617. https://doi.org/10.1002/ecs2.3617.
Riehle, J. 1994. Mineral-resource assessments in Alaska. Washington, DC: U.S. Government Printing Office.
Rioux, È., F. Pelletier, J. B. Mosbacher, F. Lesmerises, R. St-Louis, S. Kutz, and M.-H. St-Laurent. 2022. Links between individual performance, trace elements and stable isotopes in an endangered caribou population. Global Ecology and Conservation 38: e02234. https://doi.org/10.1016/j.gecco.2022.e02234.
Rioux, È., F. Pelletier, and M.-H. St-Laurent. 2020. From diet to hair and blood: Empirical estimation of discrimination factors for C and N stable isotopes in five terrestrial mammals. Journal of Mammalogy 101: 1332–44. https://doi.org/10.1093/jmammal/gyaa108.
Rogers, M. C., G. V. Hilderbrand, D. D. Gustine, K. Joly, W. B. Leacock, B. A. Mangipane, and J. M. Welker. 2020. Splitting hairs: Dietary niche breadth modelling using stable isotope analysis of a sequentially grown tissue. Isotopes in Environmental and Health Studies: 358–69. https://doi.org/10.1080/10256016.2020.1787404.
Russell, D., R. G. White, A. Gunn, and B. Spring Island. 2024. Understanding productivity of North American migratory tundra caribou. Government of Northwest Territories.
Sattler, R. 2021. Mulchatna caribou herd abundance, survival, and body condition. Alaska Department of Fish and Game.
Schwertl, M., K. Auerswald, and H. Schnyder. 2003. Reconstruction of the isotopic history of animal diets by hair segmental analysis. Rapid Communications in Mass Spectrometry 17: 1312–18. https://doi.org/10.1002/rcm.1042.
Shipley, O. N., and P. Matich. 2020. Studying animal niches using bulk stable isotope ratios: An updated synthesis. Oecologia 193: 27–51. https://doi.org/10.1007/s00442-020-04654-4.
Simard, M. A., S. D. Côté, R. B. Weladji, and J. Huot. 2008. Feedback effects of chronic browsing on life-history traits of a large herbivore. Journal of Animal Ecology 77: 678–86. https://doi.org/10.1111/j.1365-2656.2008.01374.x.
Skoog, R. O. 1968. Ecology of the caribou (Rangifer tarandus granti) in Alaska. PhD Dissertation. University of California, Berkeley. Berkeley, California.
Smith, A., C. J. Johnson, and K. Clark. 2023. Behavioral and physiological stress responses of barren-ground caribou (Rangifer tarandus groenlandicus) to industrial ice roads. Polar Biology 46: 1053–67. https://doi.org/10.1007/s00300-023-03185-x.
Staaland, H., N. A. Øritsland, and R. G. White. 1988. Digestion of energy and nutrients in Svalbard reindeer. Rangifer 8: 2–10. https://doi.org/10.7557/2.8.1.725.
Staaland, H., and R. G. White. 2001. Regional variation in mineral contents of plants and its significance for migration by Arctic reindeer and caribou. Alces 37: 497–509.
Stephenson, T. R., D. W. German, E. F. Cassirer, D. P. Walsh, M. E. Blum, M. Cox, K. M. Stewart, and K. L. Monteith. 2020. Linking population performance to nutritional condition in an alpine ungulate. Journal of Mammalogy 101: 1244–56. https://doi.org/10.1093/jmammal/gyaa091.
Stock, B. C., A. L. Jackson, E. J. Ward, A. C. Parnell, D. L. Phillips, and B. X. Semmens. 2018. Analyzing mixing systems using a new generation of Bayesian tracer mixing models. PeerJ 6: e5096. https://doi.org/10.7717/peerj.5096.
Thompson, D. P., and P. S. Barboza. 2014. Nutritional implications of increased shrub cover for caribou (Rangifer tarandus) in the Arctic. Canadian Journal of Zoology 92: 339–51.https://doi.org/10.1139/cjz-2013-0265.
Tieszen, L. L., T. W. Boutton, K. G. Tesdahl, and N. A. Slade. 1983. Fractionation and turnover of stable carbon isotopes in animal tissues: Implications for δ13C analysis of diet. Oecologia 57: 32–37. https://doi.org/10.1007/BF00379558.
Tollefson, T. N., L. A. Shipley, W. L. Myers, D. H. Keisler, and N. Dasgupta. 2010. Influence of summer and autumn nutrition on body condition and reproduction in lactating mule deer. Journal of Wildlife Management 74: 974–86. https://doi.org/10.2193/2008-529.
Valkenburg, P., R. A. Sellers, R. C. Squibb, J. D. Woolington, A. R. Aderman, and B. W. Dale. 2003. Population dynamics of caribou herds in southwestern Alaska. Rangifer: 131–42. https://doi.org/10.7557/2.23.5.1694.
Van Lanen, J. M., G. Neufeld, and C. R. McDevitt. 2018. Traditional ecological knowledge of the Mulchatna caribou herd. Alaska Department of Fish and Game.
Vors, L. S., and M. S. Boyce. 2009. Global declines of caribou and reindeer. Global Change Biology 15: 2626–33.https://doi.org/10.1111/j.1365-2486.2009.01974.x.
Webber, Q. M. R., K. M. Ferraro, J. G. Hendrix, and E. Vander Wal. 2022. What do caribou eat? A review of the literature on caribou diet. Canadian Journal of Zoology 100: 197–207. https://doi.org/10.1139/cjz-2021-0162.
Welker, J. M., J. T. Fahnestock, P. F. Sullivan, and R. A. Chimner. 2005. Leaf mineral nutrition of Arctic plants in response to warming and deeper snow in northern Alaska. Oikos 109: 167–77. https://doi.org/10.1111/j.0030-1299.2005.13264.x.
Wenzl, M., C. A. Baumhoer, A. J. Dietz, and C. Kuenzer. 2024. Vegetation changes in the Arctic: A review of Earth observation applications. Remote Sensing 16.https://doi.org/10.3390/rs16234509.
Zhao, L. Z., A. S. Colman, R. J. Irvine, S. R. Karlsen, G. Olack, and E. A. Hobbie. 2019. Isotope ecology detects fine-scale variation in Svalbard reindeer diet: Implications for monitoring herbivory in the changing Arctic. Polar Biology 42: 793–805. https://doi.org/10.1007/s00300-019-02474-8.
Open Access
Peer-Reviewed
Creative Commons
Accepted: 30 March 2026
Published: 5 June 2026
Funding for this work was provided by the Federal Aid and Wildlife Restoration Funds and Alaska Department of Fish and Game (Grant No. AKW-29), whose support is gratefully acknowledged.
Conflicts of Interest:
The authors declares no conflicts of interest.


