



Mapping community capital: Revealing local gaps in rural access
* This article is part of a Special Issue from FOSS4GNA.
CJS: https://orcid.org/0009-0009-8866-2853
BAH: https://orcid.org/0009-0005-7485-576X
Seeger, C. J., and B. A. Hanson. 2026. Mapping community capital: Revealing local gaps in rural access. Stacks Journal: 26012. https://doi.org/10.60102/stacks-26012.
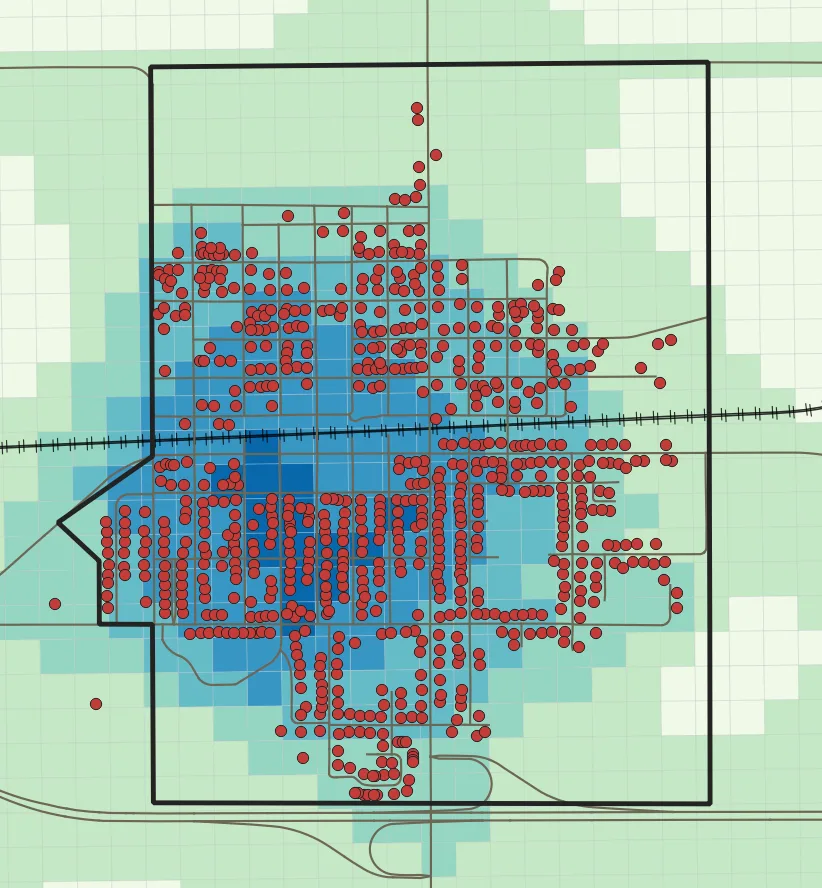
Abstract photo. Map showing spatial distribution of housing in Ogden, Iowa overlaid on a shaded grid representing extents of access to a community capital.
Abstract
In this paper we highlight our methods that demonstrate how open geospatial data and free and open-source software (FOSS) can be used to operationalize the Community Capitals Framework (CCF) at fine spatial scales and identify intra-community disparities in access to critical assets. This project builds on previous research that utilized commercial GIS software for community infrastructure spatial analysis and ongoing efforts to utilize the Community Capitals Framework to inform targeted improvements in small rural communities. Our reproducible, open-source workflow is designed for use by researchers, planners, and community stakeholders aiming to apply geospatial analysis in low-resource environments.
Keywords: community capital framework, FOSS, geographic information systems, R, OpenStreetMap, network analysis, QGIS
Introduction
Commonly used by community development research, the Community Capitals Framework (CCF) offers a structured approach that allows researchers and stakeholders to assess community strengths and weaknesses (gaps) across seven forms of capital (Emery and Flora, 2006, Flora and Flora, 2008):
-
Built Capital: The community’s infrastructure, including buildings, roads, bridges, schools, utilities, and communication systems.
-
Natural Capital: The natural resources and ecosystems that support the community, such as wildlife, scenery, parks, lakes, forests and air quality.
-
Human Capital: The skills, knowledge, and health of the community’s residents including education levels, work expertise, leadership skills, and the capacity for innovation.
-
Social Capital: The networks of relationships, trust, and reciprocity among community members. Examples include civic participation, volunteer organizations, clubs, and shared goals.
-
Political Capital: The community’s ability to influence decisions and gain access to resources through its political structures and power dynamics. Indicators include connections to decision-makers, citizen engagement in public issues, and fair representation.
-
Cultural Capital: The shared history, values, traditions, and knowledge that create a unique community identity such as festivals, local foods, art, historical places, and stories.
-
Financial Capital: The community’s economic base and resources such as savings, income, investments, grants, tax revenue, and loans.
This holistic approach of using these seven capitals has been implemented in a variety of projects and research to assist communities as they assess existing resources, prioritize strategic investments, and develop targeted interventions that improve resilience and well-being (Anglin, 2015, Garner, 2024, Güngör and Elburz, 2024).
Over the past several years, our team has collected and analyzed data indicators aligned with this framework to evaluate the strengths and weaknesses of cities and counties in the Midwest United States. Drawing on publicly available data, we assessed variation in multiple forms of capital across communities. While these indicators and assessments have offered valuable insights at the county and city level, they often mask important disparities within communities themselves. Spatial accessibility represents a critical cross-cutting dimension influencing how residents interact with each capital. Access to built, human, and social capital is mediated by spatial proximity, transportation networks, and physical barriers. Therefore, our current focus shifts to analyzing those same indicators at a finer spatial scale to better understand how access to critical services and assets is distributed within individual communities. As a result of this investigation, we propose spatial capital as an eighth capital serving as a comprehensive operational dimension that reflects geographic accessibility and distribution of community assets and the spatial connectivity of the seven capitals. This spatial lens does not replace existing capitals but enhances their measurement by capturing how infrastructure and geography influence real-world access.
To uncover these internal disparities, we apply spatial analysis techniques using free and open-source software (FOSS) and openly available geospatial data. We begin by analyzing access to key community assets—such as parks, healthcare facilities, community centers, and educational institutions—across a multi-county rural region, identifying differences in regional availability. We then zoom in on selected case study communities to map the neighborhood-level distribution of those same assets, revealing gaps in access that are often hidden by broader county- or city-level aggregates.
Methods and Materials
Due to the limited availability of authoritative city data, the process began with the collection of data from OpenStreetMap (OSM) using the R package “osmdata” and exporting the data out as a geopackage for use in QGIS. The identified community assets and service locations were categorized into one or more community capital categories to use in our analysis.
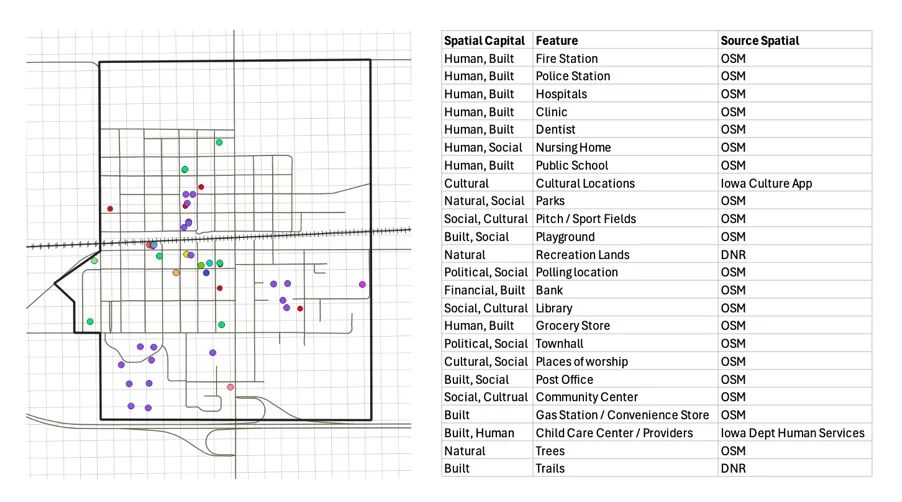
Prior to importing the OSM data into QGIS, a vector grid layer consisting of cells measuring 100×100 meters was imported. This grid was established by the research team for use in previous community assessments and is approximately the same size as a typical city block in rural Iowa communities and provides a standard reference for density and network analysis projects.
To identify the distribution of each community capital spatially within the community we utilized network analysis tools to create half-mile service areas from each community asset collected from OSM. A half-mile distance was selected for the service areas in this study because it is a commonly used threshold for walkable access in planning and public health research. Service areas help us show the proximity and distribution of assets within the community. While standard buffers could have been used rather than service areas, we have found that the service areas are able to highlight the unique conditions of a community’s infrastructure and road network in relation to access to services. It should be noted however that varying service sizes could be implemented for use to allow for multiscale analysis or regional projects.
In QGIS, the Network Analysis tool was used to create service area lines following from the point out and along the street network for a half mile. With service area lines for each point the Convex Hull tool was used to create service area polygons from the service area lines.
The next step in the analysis was to aggregate and normalize the results of the service areas in order to create a visual representation of the density and distribution of community capitals within the community. We utilized the 100-meter grid layer, the polygon service areas and the Spatial Join tool in QGIS to do this. By conducting a spatial join between the two layers we are able to get a count of the overlapping service area in the 100-meter grid layer for each cell and each community capital category.
For simplicity and for a better internal tile layout we dismissed the idea of non-square tiles early on in the design process.
Service area overlap counts were normalized by dividing the number of asset service areas in each grid cell by the total number of assets in the community, producing a relative score ranging from 0 to 100 percent. For example, if there were 10 possible locations for social capital within the community and a grid cell had a count of 5 from the results of the spatial join then the cell would get a value of 50%. This normalization made it possible to compare asset accessibility across community capital categories and then to create an aggregate total score.
This approach identified areas within the community that were distant from the community capital features and also identified potential barriers with the community. For example, in the sample community illustrated below, a railroad that runs east/west through the community impacts the distance a resident may have to travel to access a grocery store, park or the school. While this might not appear to be a major factor in a small community, one needs to consider that 60-80 freight trains cross through this community daily, and those delays waiting for a train at a crossing may be enough to dissuade a person from participating in a community activity, or attending a social event – so identifying the areas of spatial isolation is an important component of community research.
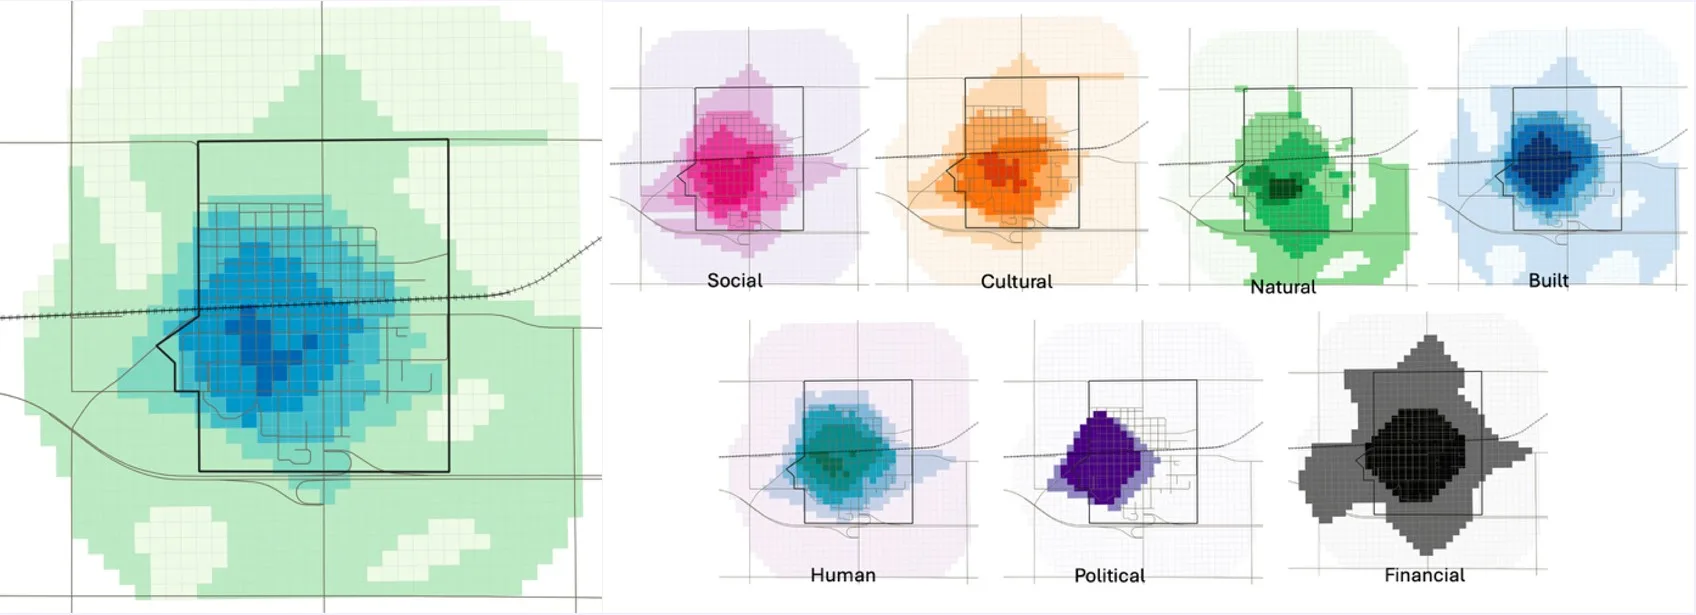
Figure 2. Comparison of asset accessibility across Community Capitals in Ogden, Iowa. The density and spatial distribution of each capitals reflect differences in asset locations and the transportation network. The composite map aggregates accessibility across all Community Capitals to illustrate the overall spatial distribution and density of community assets.
Results
We found that OSM data quality is essential for replicating this process for other communities. Inconsistent tagging of OSM data makes it difficult to collect the same assets between communities. For example, in Ogden, IA (our case study location) the high school was tagged as building = school, while the high school in Madrid, IA (a community in the same county) was tagged as amenity = school. This inconsistency makes it difficult to collect community level data for an entire county at once without conducting consistency checks and editing tags when necessary. Our case studies demonstrate 1) a method to map how regional access to services varies across rural places—and how, within those places, spatial analysis reveals localized gaps in access to essential assets like healthcare, broadband, and public infrastructure. 2) that free and open-source tools can be used to perform proximity analysis, service area analysis, and spatial overlays to identify underserved areas—places where residents may face barriers to opportunity, infrastructure, or essential services.
Discussion
Future studies will expand upon this work by developing a process to ensure OSM tag consistency, incorporating additional capital indicators and integrating more advanced spatial analysis techniques, such as multi-modal network measures, social networks, and temporal and seasonal analysis of service availability. There is also potential to combine this spatial framework with qualitative or participatory approaches to better understand how residents perceive and navigate access or interact socially and economically within their communities. Ultimately, this work demonstrates how a place-based community capital framework grounded in open data and FOSS tools—can support more informed community planning, guide targeted investment decisions, and enhance community engagement by making disparities in access more visible and actionable.
Funding Information
Funding provided by Iowa State University.
Author Contributions
Christopher J. Seeger: Conceptualization, Methodology, Writing – original draft
Bailey A. Hanson: Methodology, Formal analysis, Data curation, Writing – review & editing
Data Availability
All data and code can be found here.
Transparent Peer Review
Results from the Transparent Peer Review can be found here.
Recommended Citation
Seeger, C. J., and B. A. Hanson. 2026. Mapping community capital: Revealing local gaps in rural access. Stacks Journal: 26012. https://doi.org/10.60102/stacks-26012
References
Anglin, A. E. 2015. Facilitating community change: The community capitals framework, its relevance to community psychology practice, and its application in a Georgia community. Global Journal of Community Psychology Practice 6: 1–15. https://journals.ku.edu/gjcpp/article/view/20790/18772.
Emery, M., and C. Flora. 2006. Spiraling-up: Mapping community transformation with community capitals framework. Community Development 37: 19–35. https://doi.org/10.1080/15575330609490152.
Flora, C. B., and J. L. Flora. 2008. Rural communities: Legacy and change. Boulder, CO: Westview Press.
Garner, C. 2024. Utilizing community capitals to revitalize rural communities. PhD Dissertation. University of Georgia, Athens, GA. University of Georgia Libraries. https://openscholar.uga.edu/record/2228?ln=en&v=pdf.
Güngör, M., and Z. Elburz. 2024. Beyond boundaries: What makes a community resilient? A systematic review. International Journal of Disaster Risk Reduction 108: 104552. https://doi.org/10.1016/j.ijdrr.2024.104552.
Open Access
Peer-Reviewed
Creative Commons
Submitted: 27 April 2026
Accepted: 7 July 2026
Published: 2 October 2026
This work was supported by Planet Labs PBC.
Conflicts of Interest:
Funding provided by Iowa State University.


